Senior Engineering Interview Handbook / Chapter 107
Performance Engineering
A sustained search-regression investigation that develops performance measurement, tail analysis, bottleneck localization, mitigation, optimization trade-offs, and production validation.
Preparing audio…
Audio edition
Performance Engineering
Page tools
A fast average, a slow search
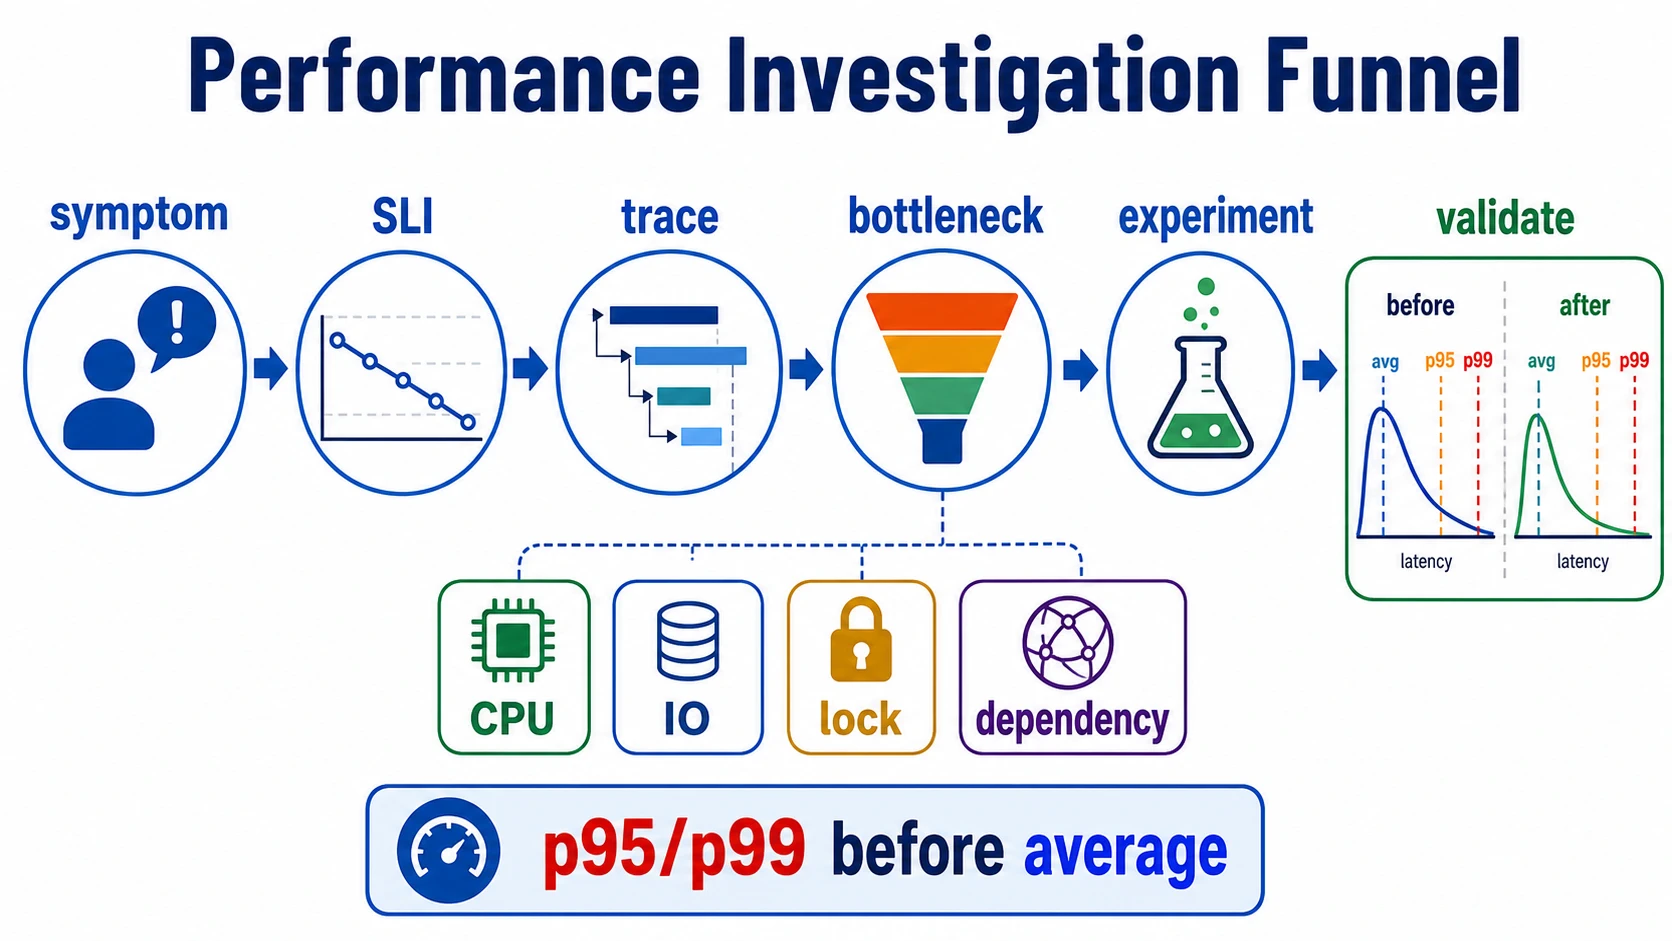
On Tuesday a team releases a compliance filter for document search. By Wednesday, enterprise customers in Europe are reporting timeouts. The service dashboard looks calmer than the support queue: mean latency has moved from 180 to 210 milliseconds, an increase small enough to dismiss. At p99, however, requests using the new filter have moved from 700 milliseconds to 3.5 seconds.
“Search is slow” is a report from the world, not yet a diagnosis. The useful claim is narrower: for this cohort and query shape, after this release, the slow end of the latency distribution crossed the user-visible timeout boundary. That statement gives the investigation somewhere to go. It also prevents a fast majority from voting the affected customers out of existence.
Performance engineering is the discipline of carrying such a claim through measurement, localization, change, and proof. The goal is not speed in the abstract. It is to improve a path that matters without quietly moving the cost into correctness, reliability, operability, or the next chapter’s cloud bill.
Give “slow” a boundary
The first useful questions are about the complaint, not the implementation. Who is waiting? What are they trying to complete? How often does it happen? When did it begin? What outcome counts as acceptable?
Those questions determine the measurement. Request latency is appropriate for the search example. A video-indexing pipeline may instead be judged by the age of its oldest useful result. An interactive page may return its API response quickly while delaying the first content a reader can act on. A batch system can have high throughput and still miss every promised deadline. Latency, throughput, freshness, saturation, timeout rate, and perceived responsiveness are related observations, not interchangeable names for speed.
The shape of the distribution matters too. A mean can improve while a small cohort gets much worse. A percentile can also mislead when traffic mix changes: today’s p99 may contain different customers, payloads, regions, or routes from yesterday’s. Segment by the attributes that could explain the pain, then compare like with like. In this case the release flag, region, tenant size, filter value, result count, and timeout rate are more informative than a single fleet-wide number.
The investigation now has a question precise enough to falsify:
Did the compliance filter make searches slow because of the query itself,
because it added authorization work, or because it concentrated load on a
particular shard or customer shape?
Follow the waiting
Choose the next instrument for the uncertainty you have. A distributed trace splits a request across services and dependencies. A CPU profile locates compute inside a process. An allocation profile reveals object churn and memory pressure. A query plan explains how a database intends to find rows. Queue age, retry rate, and worker utilization distinguish insufficient throughput from poisoned work or a slow dependency. Opening all of them at once produces activity, not necessarily evidence.
Suppose traces show that application code remains near 40 milliseconds, while the search backend accounts for almost all of the new delay. Query plans then show that combining the compliance predicate with a common tenant filter has moved large tenants from an indexed lookup to a wide scan. Shard metrics add one more fact: two large European tenants hold most of the matching documents.
The symptoms now form a causal story. The release changed the access path; tenant skew magnified that change; the wide scan created the tail. More API servers would leave the scan untouched. A response cache would add freshness and invalidation work before the team had shown that repeated identical queries were important. A lower timeout might protect threads, but it would turn slowness into explicit failure for the same customers.
This is the value of bottleneck classes. They organize a search, but they do not prescribe a fix:
- CPU pressure asks whether the path is doing avoidable computation, parsing, copying, or serialization.
- Database and I/O pressure asks about access patterns, indexes, round trips, payload size, batching, and locality.
- Locks and coordination ask what is waiting for shared state or unnecessary ordering.
- Dependencies ask about timeouts, retry amplification, isolation, and degraded behavior.
- Allocation pressure asks whether object churn and garbage collection explain pauses under representative load.
- Skew asks which tenant, key, partition, region, or payload dominates the expensive tail.
The class is useful only when observations support it. “Probably the database” is still intuition.
Stop the pain before perfecting the system
Active customer harm creates two decisions. The team can mitigate by disabling the filter for the affected cohort while keeping it enabled elsewhere. That restores the old latency, but it may also remove a compliance behavior the customer needs. If the filter is required for authorized results, returning unfiltered data is not a degraded mode; it is a security defect. The safe temporary choices may be slower asynchronous export, a constrained query shape, or an explicit unavailable response while the index is repaired.
The durable change should move the observed constraint. The team might create an index that supports the combined predicates, rewrite the query to preserve the existing access path, precompute an authorization set, or constrain filter combinations that the product cannot serve predictably. Each option creates a different obligation:
- an index can improve reads while increasing write latency, storage, and migration risk;
- precomputation can improve latency while creating freshness, backfill, and ownership rules;
- caching can help repeated reads while requiring a bounded key space, invalidation, eviction, and a source-of-truth relationship;
- batching can improve throughput while increasing the wait for each item;
- asynchronous work can protect the request path while requiring a visible completion state, idempotent retries, and recovery for stuck jobs;
- more capacity can protect a launch while hiding an inefficient design.
Performance changes are design changes. A payment confirmation cannot accept the same stale-data trade as a recommendation widget. Search may tolerate an approximate result count but cannot omit authorization constraints. Naming the new obligation is part of proposing the optimization, not cleanup for later.
Prove the path improved
A query that runs quickly on a developer laptop proves very little about the original complaint. The validation needs the same large-tenant data shape, filter combinations, concurrency, cache state, and region-dependent path that produced the tail. Compare the enabled and control cohorts across p50, p95, p99, timeouts, and errors. Check result correctness as well as speed.
Then inspect what the fix could have harmed. For a new index, watch write latency, storage growth, replication lag, and the migration itself. For a precomputed set, test freshness and behavior during backfill. For a cache, exercise invalidation and cold starts. Representative load matters because systems are nonlinear: concurrency can reveal lock contention, larger payloads can change memory behavior, and bursts can fill queues even when the daily volume looks harmless.
Finally, leave a guard proportionate to the regression. The search team may segment latency and timeouts by filter and tenant size, retain a load case for the troublesome query shape, and review the relevant plan when the schema changes. The work is complete when the original customer claim improves, the side effects are visible, and recurrence is likely to be caught—not when a benchmark number becomes attractive.
Make the reasoning inspectable
In a production, system-design, coding, or project-deep-dive conversation, a credible answer preserves this causal chain:
I would define the affected path, cohort, and user-visible measure before
choosing a fix. Then I would use the smallest evidence set that can split the
delay—traces across services, profiles inside a process, query plans for data
access, or queue metrics for backlog. Once the limiting constraint is visible,
I would mitigate active harm, make one focused change, and validate the same
cohort and latency distribution under representative load, including
correctness and the side effects introduced by the fix.
For a project story, replace the categories with evidence. “We improved performance” asks the listener to supply the engineering. A useful account names the affected path, the observed constraint, the change, the before and after distribution, and the guardrail that prevented a faster but less correct system.
Rehearse the investigation
- Turn “the app is slow” into a claim with a user path, cohort, measure, time window, and suspected change.
- Given a request trace, choose one next instrument and explain what result would change your decision.
- Compare cache, index, batching, asynchronous work, and capacity for one slow endpoint. Name the new obligation created by each.
- Write a validation plan that preserves the original workload shape and checks correctness, saturation, and downstream effects.
- Prepare a project story whose causal chain another engineer could challenge.
You are ready to use the chapter when you can resist a generic fix, explain why the average may disagree with the complaint, choose evidence according to the remaining uncertainty, and say what would disprove your preferred diagnosis.
Field reference
- Symptom: identify the user path, cohort, time window, and consequence.
- Measure: choose latency, throughput, freshness, saturation, timeout rate, or perceived responsiveness.
- Distribution: segment percentiles, errors, and timeouts by plausible causes.
- Path: split waiting across client, application, service, dependency, database, cache, queue, and network.
- Constraint: support the bottleneck class with observations.
- Mitigation: limit current harm without violating correctness or trust.
- Change: move the constraint with the smallest credible experiment.
- Validate: replay the original claim and inspect new obligations.
- Guard: make the consequential regression visible before customers report it again.