Senior Engineering Interview Handbook / Chapter 73
Observability, Performance, and Cost
A sustained investigation of observability, latency distributions, throughput, saturation, load testing, capacity planning, performance diagnosis, and architectural cost.
Preparing audio…
Audio edition
Observability, Performance, and Cost
Page tools
A healthy fleet and a failing checkout
At 10:05 on the first morning of a sale, the checkout fleet is green. CPU is at 58 percent. Memory is steady. Every instance passes its health check. The median checkout still completes in 240 milliseconds, close to its usual 220.
But p99 has climbed from 850 milliseconds to 4.8 seconds. Payment timeouts are up, completed checkouts are down, and the compute bill is rising because the autoscaler has doubled the API fleet. Customers are abandoning carts while the platform reports sixty healthy instances.
This is one problem, not three separate concerns named observability, performance, and cost. Observability supplies evidence about the work. Performance asks whether that work finishes within the product promise. Cost reveals the resources consumed by the chosen response. A useful investigation must connect all three.
The checkout path is short enough to draw:
client -> checkout API -> inventory reservation -> fraud lookup
                       -> payment authorization -> order commit
There are already tempting answers: add replicas, cache the fraud result, raise the payment timeout, or roll back the morning release. Each could help. Each could also move the failure, conceal it, or make it more expensive. The first task is to turn “checkout is slow” into a claim that evidence can defeat.
Measure the harm before the machinery
The median is healthy because most checkouts still take the ordinary path. The tail says that a smaller but important population does not. A percentile is a rank in a distribution: p99 is the duration at or below which roughly 99 percent of the measured operations completed in that window. It is not an average, and it is not the duration of one permanently unlucky user.
Percentiles need a population and a time window. The service-wide p99 may mix regions, payment methods, routes, releases, and cart shapes that behave differently. Segmenting the metric shows that nearly all of the slow requests are card checkouts in one region, and that they began minutes after a fraud rule changed. The release version is useful evidence; a customer email address or request ID would be a dangerous metric label. Labels should separate populations the team can act on without creating unbounded cardinality or placing sensitive data in the metrics system.
The product measure matters too. A latency chart alone cannot say whether customers succeeded after waiting. For this incident, the first view needs checkout attempts, completions, errors, p50/p95/p99 latency, and abandonment, split by region and payment path. Those signals establish impact. Resource metrics come next because they may explain it.
Tail latency compounds across a workflow. When a page or transaction depends on many calls, one slow dependency can dominate the experience even though every dependency has a respectable median. Break the duration into waiting and work instead of treating the request as one opaque number:
end-to-end latency
  = queue wait + application time + dependency time + network time
The decomposition is deliberately plain. Its job is to tell us where to look, not to pretend that timings never overlap.
Four instruments, four kinds of question
Metrics reveal shape across many operations. They show when the tail moved, which population moved with it, whether demand changed, and which resources approached a useful limit. Request rate, error rate, latency distributions, database connection occupancy, lock wait, retry rate, and checkout completion are useful here because each bears on a live hypothesis. A dashboard containing every metric the system emits would make the investigation harder, not safer.
Logs record discrete events and decisions. A structured checkout log can say
that request req_abc entered the new fraud policy, attempted payment once,
and returned a timeout after 4.9 seconds. It should record safe correlation
context, rule version, result class, retry count, and duration—not the card
number, access token, or full cart payload. Logs are strongest when they
explain why the program took a branch. Repetitive success prose is expensive
noise.
Traces follow a unit of work across boundaries. A trace ID propagated through
the API and its dependencies lets the investigator compare an ordinary
checkout with a tail checkout. The slow traces show little queue wait at the
API and no unusual network delay. They spend most of their time inside
fraud_lookup, then wait for a database connection before the order commit.
Several contain a payment retry after the fraud call has already held the
transaction open.
Profiles connect resource consumption to code. A CPU profile can expose hot parsing, compression, encryption, or serialization; an allocation or heap profile can distinguish churn from retained memory; a contention profile can show time lost on locks or pools; an I/O profile can reveal blocking calls. A profile of an idle instance proves almost nothing about this sale. Capture it under the affected workload and identify the build, input population, and time window. In this incident the trace has already pushed the investigation toward database query and lock evidence; if application time had dominated, a representative profile would be the next instrument.
These signals are complementary, not four boxes to tick. Metrics locate the affected population. Traces reveal its path. Logs explain a branch or failure. Profiles locate resource use inside code. The right question chooses the instrument.
From correlation to a causal claim
The fraud release and p99 moved together. That is a lead, not yet a cause. The team compares slow and fast traces, inspects the query plan, checks lock waits and connection-pool occupancy, and reads the release diff. The new rule runs an unindexed lookup while the checkout transaction remains open. Under the sale’s request mix, the lookup holds connections longer. Requests wait for the pool; some payment calls time out; retries keep more work alive. Adding API replicas opens more database connections and increases the pressure.
Now the hypothesis has a mechanism:
new lookup
  -> longer transaction and more database work per checkout
  -> connection saturation and lock wait
  -> tail latency and timeouts
  -> retries and more work
  -> lower useful throughput at higher cost
It also makes predictions. The affected rule version should appear in tail traces. Connection wait should rise before or with p99. Disabling the rule for an allowed cohort should improve the tail without changing ordinary checkout time. An index or a shorter transaction should reduce database time at the same arrival rate. A claim that cannot make a risky prediction is still a story fitted to a dashboard.
Mitigation and repair need not be the same action. If fraud policy permits, the incident response may disable the new rule for low-risk carts, cap retries, and stop further scale-out to protect the database. The durable repair can add the appropriate index and move enrichment outside the transaction. Removing fraud checks indiscriminately would buy latency with loss exposure; raising timeouts would keep users and connections waiting longer. The product and security constraints remain part of the performance decision.
Load, work, capacity, and saturation
The incident becomes easier to reason about when three quantities are kept separate:
load      = work arriving per unit time
work      = constrained resources consumed per unit
capacity  = useful work the system can complete per unit time
Throughput is completed work per unit time, not the number of requests merely accepted. If arrivals remain above completions, waiting work accumulates. In a queue this is visible as depth and oldest-item age. In a synchronous service it appears as connection wait, run queues, in-flight requests, timeouts, and retries. Low worker CPU does not disprove overload when the workers are waiting on a database pool or external quota.
Before the release, suppose the fraud step consumed about 6 milliseconds of database time per checkout. At a peak of 900 checkouts per second, that is 5.4 database-seconds of work arriving each second, before other queries and variance. If the new lookup raises the step to 18 milliseconds, it demands 16.2 database-seconds each second. That change in work per unit can exhaust a database that handled the same traffic comfortably yesterday. More API capacity does not change the arithmetic.
Saturation is the behavior near a resource’s useful limit. CPU develops a run queue; memory pressure creates garbage-collection pauses, reclaim, swapping, or kills; disks accumulate I/O wait; pools make callers wait; queues age; external services enforce quotas. The useful limit is normally below the advertised maximum because the system needs room for variance, deploys, failover, repair, and traffic that cannot be predicted perfectly.
There are only a few fundamental levers. Reduce load by shedding optional work, limiting admission, caching, or batching. Reduce work per unit with a better query, smaller payload, less fan-out, or precomputation. Increase safe capacity with larger pools, replicas, partitions, or quotas. Change the product promise by making work asynchronous or accepting lower freshness. Every lever has a cost or correctness consequence, and every capacity increase must be followed downstream. Ten new workers can mean ten times the pressure on a database, lock, provider, or hot partition.
Capacity planning meets a real load test
Capacity planning starts with the peak workload mix, not a daily average. The team needs expected arrival rate, work per operation, data shape and skew, dependency quotas, redundancy during a failure, and deliberate headroom. A rough model is enough to expose the dominant resource:
required resource rate
  ~= peak operation rate * resource work per operation

provisioned capacity
  >= required resource rate * failure allowance * headroom allowance
The factors are not universal constants. They are declared assumptions to test. If one zone can disappear, the remaining zones must still meet the intended service level. If a sale can triple traffic in two minutes, capacity that takes ten minutes to warm cannot be counted as immediate protection.
A credible load test preserves the features that make production difficult: the mix of payment methods and fraud rules, large and small carts, realistic database history, key skew, cache state, authentication, background jobs, provider latency, and write contention. Begin with a baseline, run the expected peak, push beyond it to find the break, sustain load long enough to expose leaks or compaction lag, apply a spike, and slow a dependency while the system is busy. These are different questions, even if one test program can ask them.
The load generator can lie politely. If it waits for each slow response before sending the next request, its arrival rate falls just when the service begins to struggle. The report then omits requests that real users would have sent. For a sale-capacity claim, schedule arrivals independently of response time, record any arrivals the generator itself could not issue, and distinguish offered load from completed throughput.
Success is not “the test reached 900 requests per second.” It is that the representative system sustained the promised arrival pattern with acceptable checkout completion, p95 and p99 latency, errors, saturation, correctness, and unit cost—including during the failure condition the capacity plan assumes.
The bill is evidence too
The original response doubled the API fleet, yet useful throughput fell. That cost increase is diagnostic: the team paid for capacity outside the bottleneck. A practical cost model follows the work rather than starting with vendor line items:
unit cost per successful checkout
  = compute + storage + data transfer + managed-service use
  + telemetry + allocated reliability capacity
Engineering effort and operational load also matter when comparing designs, even if they do not appear on the same infrastructure invoice. The useful denominator is a completed product outcome. Cost per API request can look better while retries inflate request count and fewer customers finish.
Unit cost should be segmented cautiously, just like latency. Region, product tier, or workflow may reveal an architectural driver. Per-user metric labels would create cardinality and privacy problems; billing or analytical systems may be the safer place for detailed allocation. Watch how cost changes with traffic. Linear growth may be expected. A sharp increase in cost per successful checkout suggests more work per unit, lower completion, a pricing threshold, or a shared resource being used inefficiently.
Telemetry has its own economics. High-cardinality metrics maintain many time series. Full success logs multiply with request volume. Unsampled traces and long retention consume storage and transfer. Reduce them according to investigation value: aggregate repetitive events, sample ordinary success paths, retain errors and slow traces more aggressively, separate audit records from debug logs, redact before export, and tier retention. Cutting the only evidence that can explain a rare payment failure is not an optimization; it is borrowing from the next incident.
Headroom and redundancy also look wasteful only when their product purpose is missing. Spare capacity that preserves checkout during a zone loss is part of the reliability promise. The decision becomes defensible when the team can name the failure it covers, the capacity it preserves, and the value of the outcome.
Write the diagnosis so it can be wrong
A short diagnosis note is more useful than a large incident template when it captures the chain and the decision:
Symptom
  Card checkout p99 rose from 850 ms to 4.8 s; completions fell 7%.

Scope
  One region, card path, beginning after fraud-rule version 41.

Baseline and evidence
  p50 is nearly unchanged. Tail traces spend time in fraud_lookup and
  connection wait. The query plan scans the rule table; lock wait and pool
  occupancy rose. API CPU remains below saturation.

Current claim
  An unindexed lookup inside the transaction lengthens connection holding;
  sale traffic and retries saturate the database path.

Intervention
  Disable the rule for the policy-approved low-risk cohort, cap retries,
  stop API scale-out, add the index, then shorten the transaction.

Validation and rollback
  Restore checkout p99 below 1 s and completions to baseline without raising
  payment errors or fraud exposure beyond policy. Re-enable only under a
  representative load test and canary.

Cost
  Remove ineffective API replicas; compare database work and infrastructure
  cost per successful checkout before and after repair.
This note distinguishes observation from inference. It names the missing proof, the immediate risk, and the measurements that could force a rollback. It can travel through an incident review, a design discussion, or an interview without becoming a recital of monitoring products.
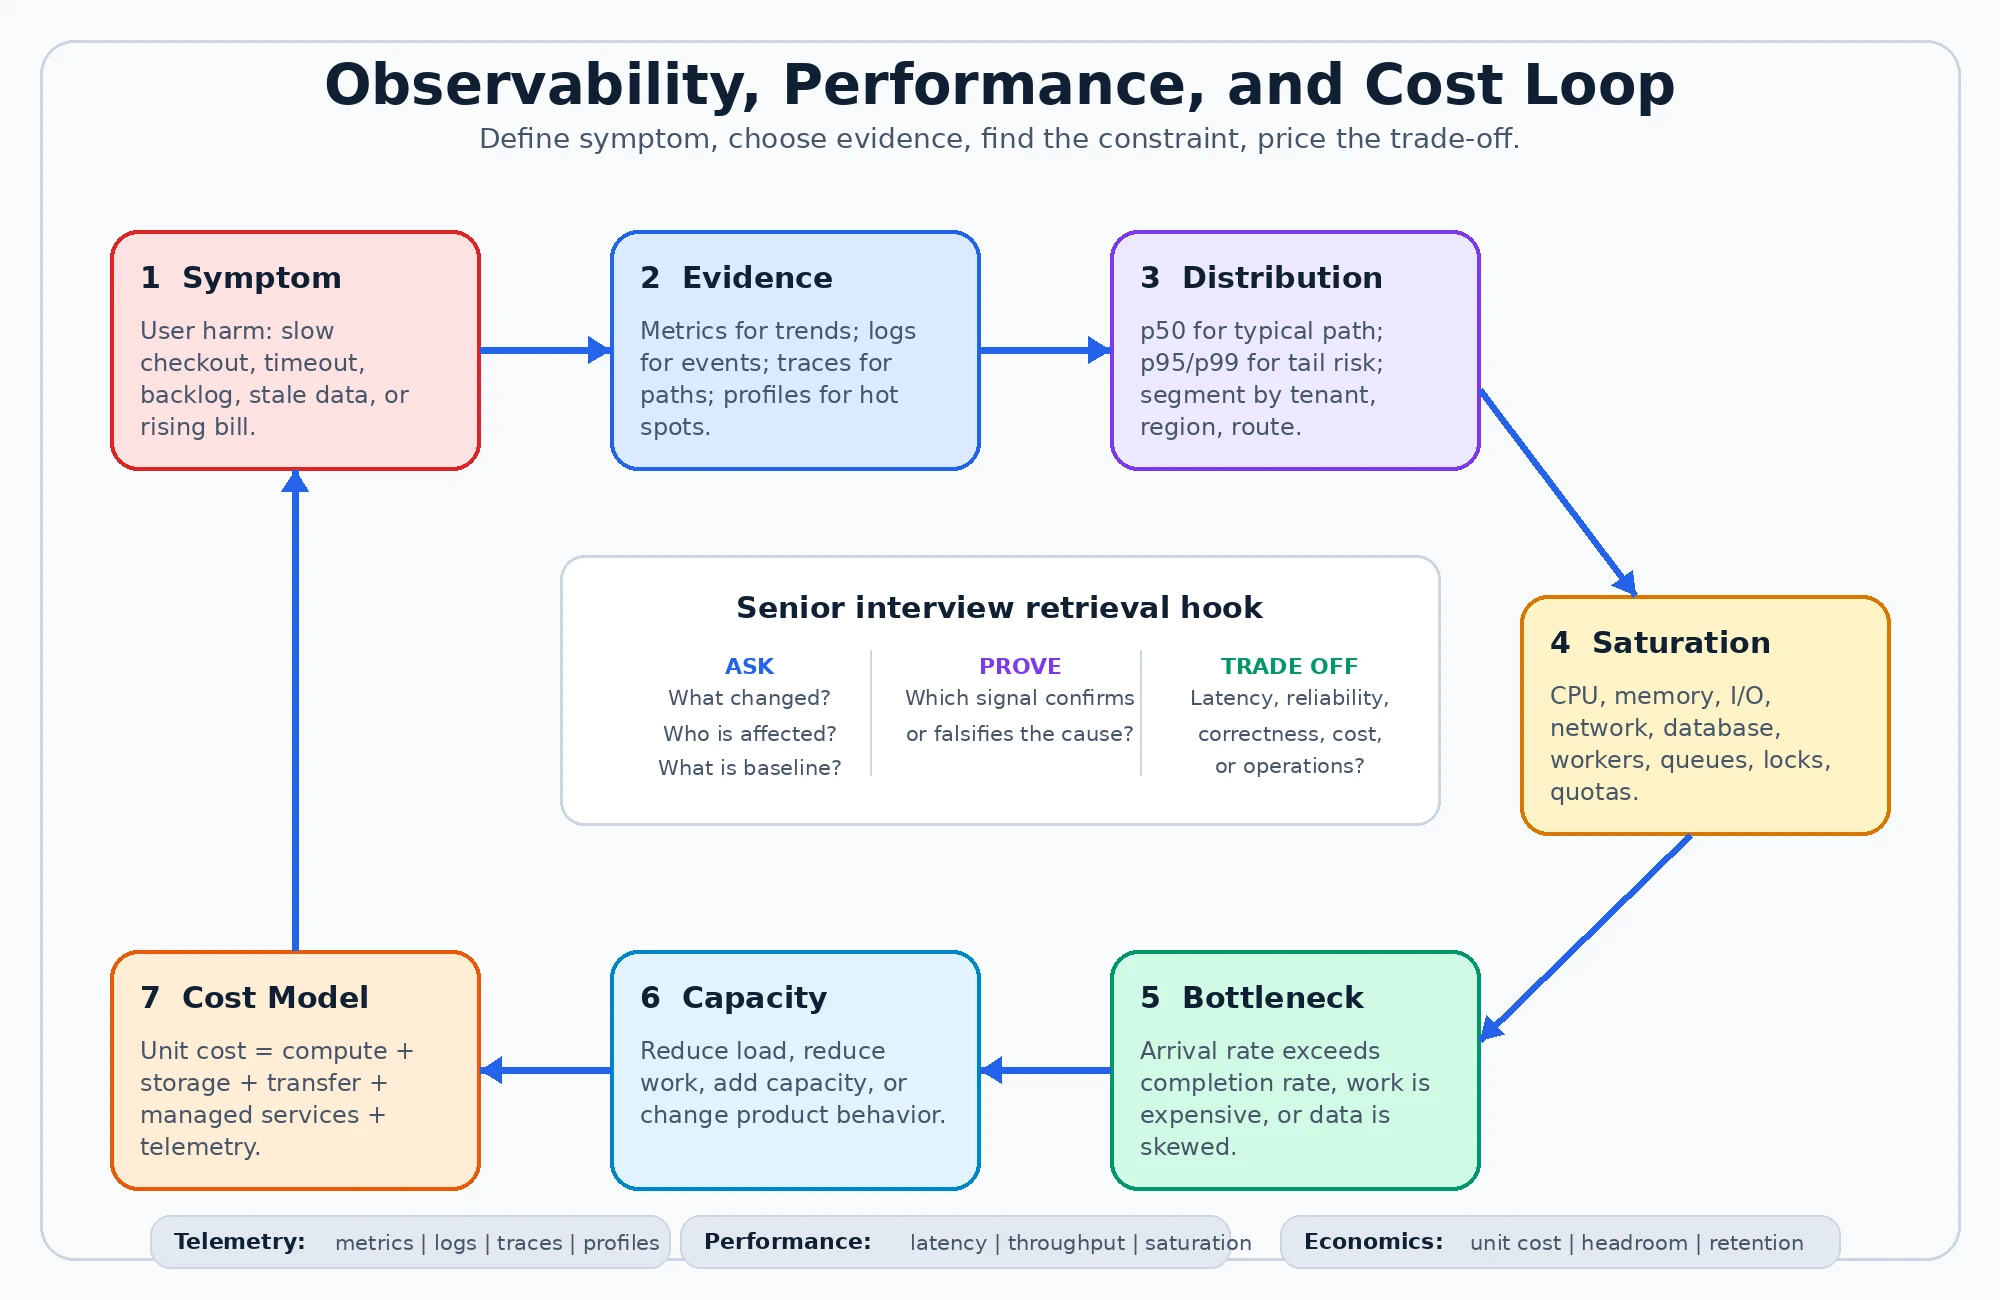
In a senior interview, the same movement is compact: define the affected user and distribution; ask which evidence would confirm or falsify a cause; separate load, work, and capacity; identify the saturated resource; mitigate without moving the bottleneck; validate both the product promise and the unit cost. Naming a telemetry tool is optional. Making the reasoning inspectable is not.
The checkout fleet was healthy only under a shallow definition of health. Once health means completed purchases within the latency and risk promise, the green instances, the long tail, and the rising bill tell one coherent story. That is the purpose of observability: not to collect more facts, but to make a better decision possible before the system spends more money doing less useful work.