Solo Founder Product Engineering Handbook / Chapter 40
Metrics That Matter Before PMF
Choose pre-PMF metrics that reveal value, activation, retention, revenue quality, qualitative pull, and segment truth.
Preparing audio…
Audio edition
Metrics That Matter Before PMF
The Week When Two Users Matter More Than 140
A founder has built a product that turns project notes into weekly executive summaries. The launch produced 900 visits, 140 signups, 46 generated summaries, and eight paid pilots. On Monday morning, every number appears to point in the same direction: improve conversion and find more traffic.
Then the founder reads the accounts one by one.
Freelancers generate a summary, download it, and disappear. Startup operators connect a data source but never send the result. Small agencies take longer to set up, yet two of them send summaries to clients on Friday, return the next week, and ask for an export defect to be fixed before the next reporting deadline.
The aggregate numbers were accurate. The conclusion was wrong.
Before product-market fit, measurement is not a report on how well the company is doing. It is a way to find out who receives value, what they do when value arrives, whether they come back when the problem returns, and what the founder should change next. A metric earns weekly attention only if it can change a product, engineering, pricing, positioning, or customer-selection decision.
The two agencies may be more important than the other 138 signups. The work is to prove or disprove that possibility without turning a small sample into a comforting story.
Start at the Far End of the Promise
Acquisition is the beginning of the company’s path. It is not the beginning of customer value. To choose a useful metric, start at the other end: what has become better in the customer’s work?
For the agency, the product has not delivered value when somebody signs up, connects a project tool, or presses Generate. Those actions happen inside the product. The promised work leaves the product when an account sends a client-ready report on time. That is a plausible primary value behavior because it names the customer, the completed job, and the outcome the customer can use.
The same test changes the metric for many products. An appointment is confirmed without manual coordination; a production API request succeeds inside a real system; a compliance packet is reviewed before its deadline; a proposal reaches an actual prospect. Each behavior sits closer to the customer’s job than the feature that helped produce it.
A good primary value behavior answers three questions:
- Which segment or account is being judged?
- What useful job was completed?
- What outcome left the product and entered the customer’s workflow?
This definition is both a product decision and an engineering obligation. The system must preserve enough evidence to recognize the behavior. That may be an analytics event, a durable database state, a payment record, a sent artifact, or a line in a founder-maintained account log. Before PMF, manual observation is often sufficient. Ambiguous observation is not.
For the reporting product, summary_generated is useful diagnostic evidence, but client_report_sent is closer to value. The event needs an account identifier, a send time, and whether founder assistance was required. It does not need every conceivable property. Instrument the promise first; add detail only when a real decision cannot otherwise be made.
Activation Is the First Completed Crossing
Activation is the first time a new target account experiences value, or reaches the nearest honest precursor when value occurs outside the product and cannot yet be observed directly. It marks a crossing from interest into evidence.
The agency does not activate by creating a workspace. It activates by sending its first client-ready report. If sending happens elsewhere, exporting a complete report for a named client may be the best observable precursor, but the founder should record the limitation instead of quietly redefining setup as success.
This distinction makes an activation problem diagnosable. If twelve suitable agencies begin setup and only three send a report, the founder can inspect the path between arrival and first value. Perhaps data import is fragile. Perhaps the promise attracts agencies without recurring reporting work. Perhaps users do not trust the output enough to put it in front of a client. Perhaps the founder’s guided onboarding supplies judgment the product does not yet contain.
Time-to-value adds useful pressure. An agency that must finish Friday reporting but needs nine days to activate has not merely encountered a slow funnel; it has missed the working rhythm that created demand. Measure elapsed time from a meaningful starting point, such as accepting an invitation or beginning import, and separate waiting caused by the customer from waiting caused by the product.
Assistance must remain visible. A concierge onboarding call can be excellent discovery and may be the right way to serve the first accounts. If the founder cleans every import and edits every report, however, the activation rate describes a combined service rather than the product alone. Label assisted activation. It is evidence, but it answers a different question.
When activation is weak, acquiring more users usually enlarges the leak. The next move is to inspect target fit, the promise, setup, trust, and the path to first value.
Wait for the Problem to Return
A convincing first experience does not establish product-market fit. The problem must recur, and the customer must choose the product again.
Retention should therefore follow the natural frequency of the job. Weekly client reporting calls for a second report in the next reporting cycle. Monthly compliance work calls for a return near the next deadline. Incident-response software may be retained through continued production coverage and use when another incident occurs, not through a daily login. A developer product may show retention through recurring production requests even when nobody revisits its dashboard.
The natural frequency keeps the measure honest in both directions. Daily activity can flatter a product whose real job occurs monthly, while a daily-use product should not excuse weak repetition by pointing to one visit later in the month.
Begin with accounts, not percentages. Ask which activated accounts were expected to encounter the problem again, which completed the value behavior, which needed prompting or founder intervention, and which did not return. With a small customer base, reading the individual histories is more informative than decorating a fragile percentage with decimal places.
Cohorts make the comparison fairer. Group accounts by a meaningful starting period—often the week or month of activation—and ask whether each cohort repeats value at the next expected opportunity. Keep segment and acquisition source attached. If launch traffic, personal referrals, and manually recruited agencies are mixed together, an average can hide both a promising wedge and a broken acquisition channel.
Frequency, depth, and breadth can help explain retention, but they should not replace it. Sending three reports instead of one may show deeper use. Inviting an account manager may show broader adoption. Neither proves repeated value if the agency does not return for the next client cycle. Use activity measures to explain the primary behavior, not to manufacture a healthier substitute.
Payment Joins the Evidence
Money is consequential behavior, but it still needs interpretation.
A paid pilot after activation shows more than a compliment. A renewal after another natural cycle shows more than the first payment. Expansion can show that more work or more people are moving into the product. These signals grow stronger when they follow repeated value and weaker when they depend on an unusual discount, a personal relationship, custom production, or founder persuasion that cannot be repeated.
For a solo founder, revenue quality includes the cost of serving the account. An agency that pays $300 and consumes six hours of bespoke report editing may prove that the problem is painful. It does not yet prove that the current product can serve the segment. Record manual work, support time, discounts, and one-off commitments beside payment. Otherwise revenue can conceal a consulting business that the dashboard calls software.
Churn deserves the same treatment. A cancellation after successful recurring use means something different from a trial that never activated. One may expose price, reliability, changing need, or a missing boundary in an otherwise valuable workflow. The other may say the promise, segment, or path to first value was wrong. Attach churn to the account’s history before drawing a product-wide conclusion.
Referrals and expansion are useful when they reveal how value spreads. An agency inviting the account manager who owns client delivery is stronger evidence than a social share prompted by a reward. A team moving a second client into the product is stronger than an additional login with no completed work. Count the consequence, not merely the click.
Let Customer Language Explain the Behavior
Metrics reveal a pattern; they rarely reveal its cause. Customer language helps the founder decide what to investigate.
“This is cool” expresses approval. “We need the export repaired before Friday’s client review” exposes a recurring job, a deadline, and dependence on the product. The second statement becomes much stronger when the account sent last week’s report and is attempting the next one.
Qualitative pull often appears when customers:
- describe the product in the language of their existing workflow;
- return despite missing secondary features;
- invite the colleague responsible for the job;
- compare the product with a painful current alternative;
- request improvements that deepen the core value path;
- complain quickly when a recurring workflow is blocked.
Support belongs in this evidence. A defect in a decorative preference and a defect that prevents Friday delivery may have the same error count but very different product meaning. The latter can corrupt retention evidence: the customer may have wanted to return but the product failed at the promise. Reliability records, support notes, and product metrics must meet at the account and the value event.
Do not turn a few vivid messages into proof. Attach notes to observed behavior, payment, referral, or churn. Qualitative evidence explains why a behavioral pattern may be forming; it does not absolve the founder from checking whether the pattern exists.
Find the Segment Before Trusting the Average
Pre-PMF measurement is a search for concentrated pull. Aggregate performance matters later. During search, it can erase the differences the founder most needs to see.
Return to the reporting product. Imagine that only twelve of the 140 signups are small agencies with recurring client reporting. Six of those agencies send a first report. Four send another report in the next weekly cycle. Three continue a paid pilot, and all three use the product without custom report writing from the founder. Their support notes cluster around import cleanup and export reliability, not requests for unrelated features.
That is not product-market fit. The sample is too small, acquisition may depend on the founder, and half the target accounts did not activate. It is nonetheless a coherent signal worth pursuing. The next work is to learn why the six agencies stalled, shorten time-to-value for qualified agencies, protect the report-delivery path, and recruit enough similar accounts to see whether repetition survives.
Now imagine instead that the paid agencies came from three different segments, never sent a second report, and bought only after bespoke demonstrations and discounts. The same revenue total would point toward a different decision: stop polishing the reporting workflow and revisit the customer and problem thesis.
Useful segment lenses include role, account type, use case, urgency, acquisition source, onboarding path, price, and assistance required. Choose the few that express an actual hypothesis. Tagging every account in twenty ways creates classification work without creating insight.
Small samples require humility, not blindness. Do not announce a market from two retained accounts. Do not discard the two because the overall rate looks weak. Treat the pattern as a lead: name it precisely, seek more comparable evidence, and write what result would change your mind.
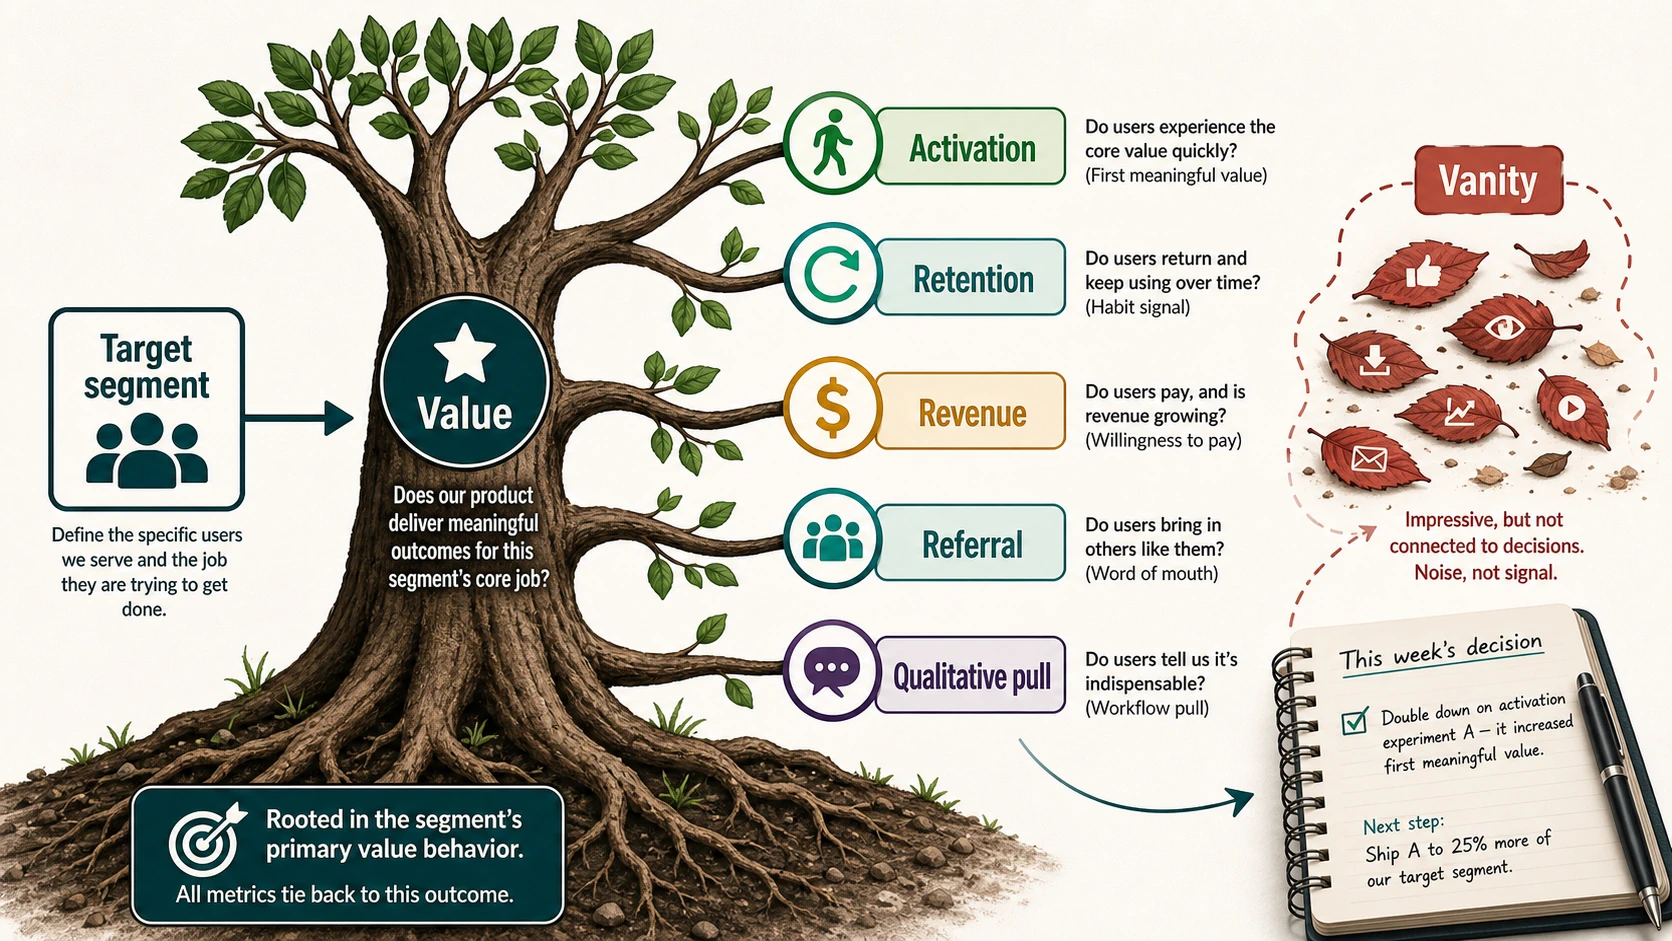
Give Every Metric a Job
The pre-PMF metric set should fit into one causal story.
At its root are the target segment and the primary value behavior. Activation asks whether suitable accounts reach that behavior for the first time. Retention asks whether they repeat it when the problem returns. Revenue quality asks whether money follows repeatable value without intolerable founder labor. Qualitative pull helps explain the behavior. Acquisition, signup, time-to-value, feature use, referrals, churn, and expansion are diagnostic measures: keep them when they explain a break or a strengthening in that story.
This hierarchy prevents a common escape. When retention is uncomfortable, the founder cannot promote traffic or feature clicks to the top of the page and call the week successful. Those numbers may explain where users came from or what happened on the way. They do not replace repeated customer value.
A metric should finish a decision sentence:
If this changes for this segment, I will decide whether to ________.
For example: if qualified agencies begin imports but fail to send a first report, inspect setup and trust before buying more traffic. If they activate but do not return in the next reporting cycle, investigate whether the problem recurs, the output is useful, or the workflow fits. If they retain only with heavy founder production, narrow the service boundary or automate the specific work that has become understood. If they retain and pay but export failures threaten deadlines, reliability has earned priority over a broader feature set.
The metric triggers an investigation; it does not supply a cause. Write the plausible explanations before choosing work, then collect the cheapest evidence that can distinguish among them. This is how measurement becomes judgment instead of ritual.
The Pre-PMF Metrics Brief
Before building a dashboard, write the measurement argument in ordinary language:
For [target segment], when [problem trigger] occurs, the product proves value when [primary behavior] happens. A new account activates when [first value event] occurs. It is retained when [repeat behavior] occurs at [natural frequency]. Payment is strong evidence when [revenue-quality condition]. We will look for [behavior-backed customer language] and separate [important segment or assistance distinction]. If the evidence changes, we will decide whether to [next decision].
Then test the brief against recent accounts. Can the founder identify the value event without guessing? Does activation represent experienced value rather than setup? Is there a real next opportunity at which retention can be judged? Are payment and founder labor recorded together? Can target accounts be separated from casual or wrong-fit users? Does each supporting measure lead to a decision or an investigation?
If the answer to one of those questions is no, repair the definition or the smallest missing record. Do not begin by purchasing a larger analytics system. A spreadsheet, a database query, payment history, support notes, and a weekly account review can produce decision-grade evidence while the product and segment are still changing.
Turn the coherent brief into a compact weekly dashboard without renegotiating the hierarchy every time the tools make another chart easy to add.
Exercise
Choose the segment that currently appears most promising and inspect every account in it.
For each account, record the first completed value behavior, whether founder assistance was required, the next natural opportunity for the problem to recur, what happened at that opportunity, payment and support burden, and one piece of customer language attached to behavior.
Write the pre-PMF metrics brief. Then take every metric currently in the weekly view and finish the decision sentence: “If this changes for this segment, I will decide whether to…”
Keep a metric if it proves value or explains activation, retention, revenue quality, qualitative pull, or segment fit. Demote it if it provides context but no current decision. Remove it if it offers only reassurance.