AI Systems Handbook / Chapter 34
Observability, Monitoring, and Drift
Connect service, data, model, safety, cost, and user-outcome signals to owned thresholds and response playbooks.
Preparing audio…
Audio edition
Observability, Monitoring, and Drift
The Green Dashboard and the Failing Assistant
An internal support assistant has 99.95 percent availability, acceptable latency, and no increase in HTTP errors. Yet support tickets are taking longer to resolve. Agents paste the assistant’s answers into cases, discover that the procedure belongs to the previous product version, and redo the work themselves. Fewer of them bother to leave feedback.
The service dashboard is green because the software is serving requests. The assistant is failing because the dashboard cannot see evidence freshness, task success, or the work required to recover from a bad answer.
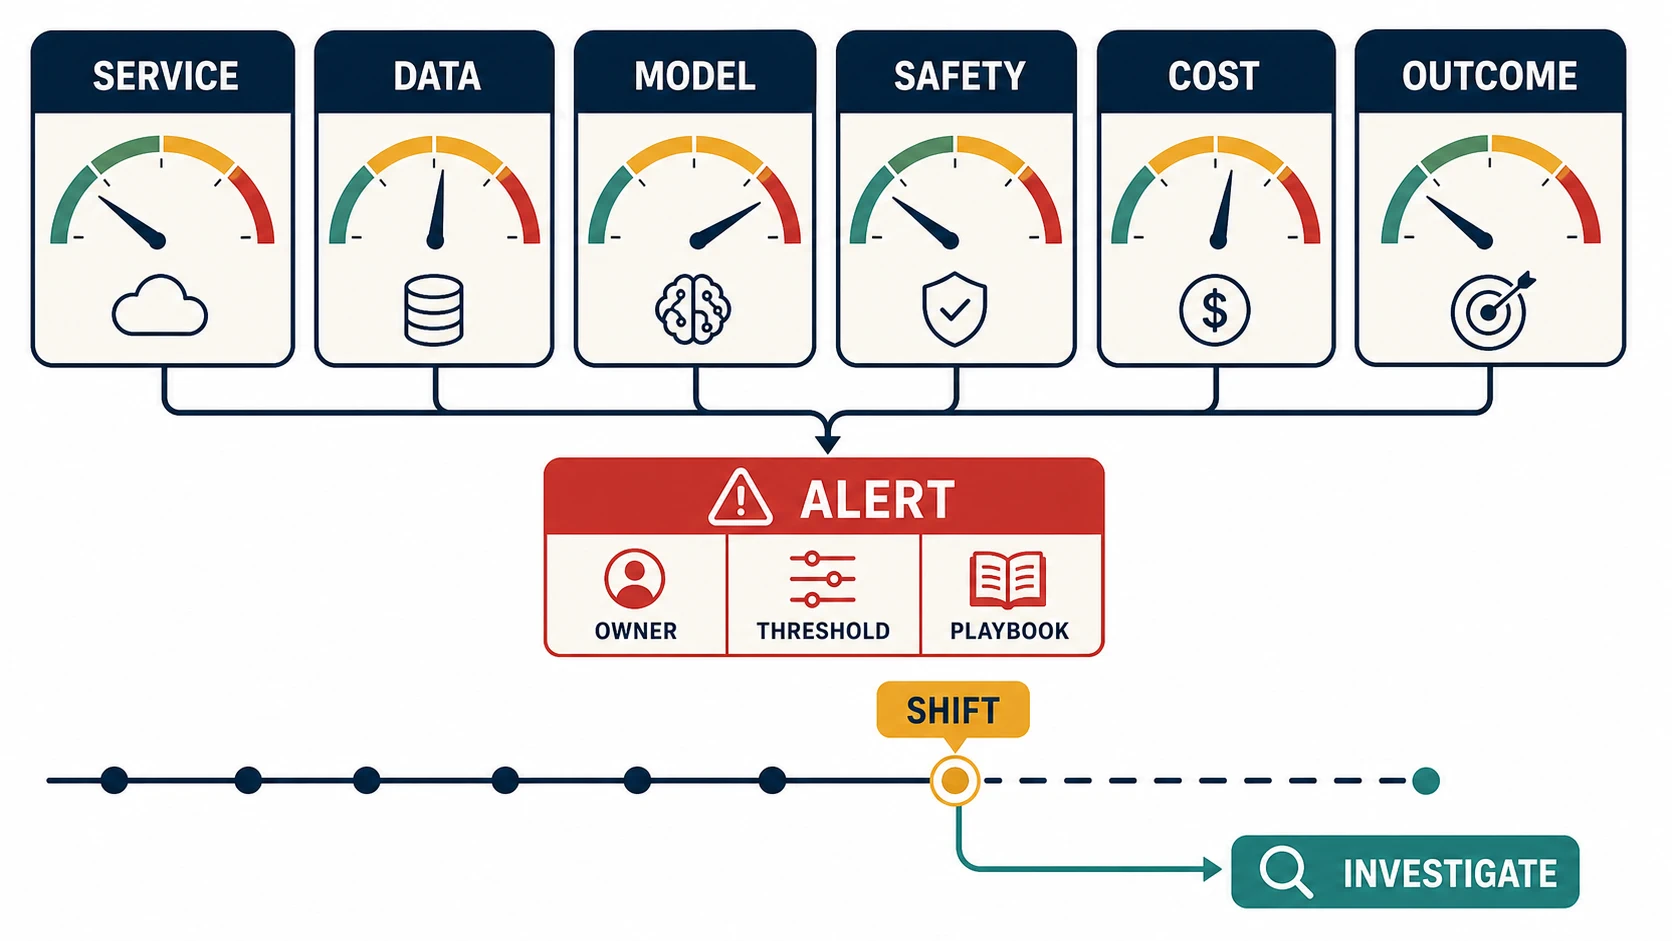
Observability provides enough connected evidence to explain system behavior. Monitoring selects from that evidence to detect conditions that require action. A useful signal has a baseline, threshold, owner, playbook, and known blind spots.
Observe the Behavior Path
The operators begin with one failed answer. Within justified privacy limits, they need to connect it to:
- release bundle and environment;
- input schema and relevant data-quality results;
- model, prompt, inference, and policy versions;
- retrieved sources, ranks, dates, and authorization outcomes;
- tool calls, arguments, approvals, results, retries, and side effects;
- output validation, filtering, abstention, escalation, and user display;
- latency, tokens, compute, dependency calls, and cost;
- feedback, corrections, appeals, task completion, and later ground truth.
Correlation or trace identifiers carry the release identity from the previous chapter through these components. Without that connection, the team knows only that an answer was wrong. It cannot distinguish a missing document from a retrieval miss, an ignored passage, a policy transformation, or a citation hidden by the interface.
Do not log everything by default. Raw prompts, documents, outputs, embeddings, human notes, and tool arguments may contain personal, confidential, or regulated data. Define purpose, minimization, access, redaction, retention, deletion, and protected investigative access. Sometimes a structured event—policy category, document identifier, hash, score, and version—provides the operating evidence without retaining full content.
Follow the Failure Across Six Evidence Planes
Service Health
Availability, latency by percentile, throughput, timeouts, error rates, queue depth, saturation, dependency health, and recovery establish whether the service can do work. Break them down by release, route, region, model, and important workflow. In this incident, the aggregate is healthy, but that observation eliminates only one family of explanations.
Data and Context
Schema violations, missingness, range and category changes, freshness, volume, duplication, source mix, label delay, permission-filter outcomes, corpus coverage, index age, and deletion completion reveal what the system is being asked to work with. For generative systems, input length, language, topic, intent, retrieved-source mix, and context truncation can expose a new operating regime.
Here the query mix changed after a product migration. The corpus did not: its freshness measure reports a recent index build, but its coverage measure shows that the new product vocabulary has no current documents. Freshness and coverage answer different questions.
Model and Component Behavior
Predictive systems may need score distributions, calibration, threshold rates, feature-attribution summaries where appropriate, and delayed quality measures. Generative systems may sample task success, groundedness, citation correctness, instruction following, refusal and abstention quality, format validity, and human-rubric results. Agents add step count, termination, tool success, approval compliance, budget, state errors, and recovery behavior.
The support assistant is grounded in the documents it retrieved, so groundedness remains high. Citation correctness by product version falls. A single quality score would have allowed the stronger signal to hide inside the weaker one.
Safety, Security, and Privacy
Policy violations, suspected injection, blocked disclosure, cross-tenant access attempts, unsafe tool requests, anomalous rates, data-loss-prevention signals, severe complaints, and control bypass show whether the system remains inside its authority. A rising block rate can mean attack, user confusion, a broken classifier, or legitimate demand the system cannot serve. The number is evidence, not a verdict.
Cost and Capacity
Unit cost, tokens, retrieval and tool overhead, cache behavior, reviewer minutes, queue capacity, fallback rate, and vendor quotas make resource pressure visible. Cost can also be a safety signal: a looping agent or adversarially long context can exhaust budgets and degrade other services.
User and Business Outcomes
The final plane asks whether the workflow is improving: resolution, quality, time, corrections, appeals, abandonment, conversion, loss, safety, accessibility, or another defined outcome. Include affected people and downstream work, not only direct-user satisfaction. High acceptance can reflect automation bias; high override can mean either a weak model or healthy oversight.
For the assistant, rising resolution time and correction severity reveal the failure before explicit feedback does. Silence was counted as satisfaction even as users were repairing answers elsewhere.
The six planes are not six independent dashboards. They are views of one behavior path. Service health says the assistant answered; corpus coverage says what evidence was available; citation correctness says what it used; workflow outcomes say whether the answer helped. Their connection turns a symptom into an investigation.
Distinguish Skew, Drift, and Degradation
Use terms precisely:
- training-serving skew: the features, transforms, or execution path differ between training and serving;
- evaluation-serving skew: production inputs or contexts differ from the evaluation population;
- data drift: the distribution of observed inputs changes over time;
- concept drift: the relationship between inputs and the desired target changes;
- label or policy drift: the definition of acceptable behavior, ground truth, or organizational policy changes;
- performance degradation: the system’s measured quality or outcome worsens;
- behavioral regression: a release performs worse than its baseline on a defined test or production measure.
Data drift does not prove performance degradation. A marketing campaign can change language while the assistant continues to work. Performance can also degrade with no obvious input drift because a dependency, model alias, corpus, label process, reviewer workload, or policy changed.
The new terminology is data drift. The missing current procedures are a coverage failure. The longer resolution time is performance degradation. Those statements can all be true at once, but they imply different remedies.
Treat a shift as a trigger for investigation:
- validate the telemetry and data pipeline;
- locate affected versions, segments, sources, and time window;
- inspect representative cases and delayed ground truth;
- check releases, dependencies, workflows, policies, and external events;
- estimate user impact and control effectiveness;
- contain if necessary;
- choose data repair, rollback, threshold change, retrieval update, prompt or policy repair, retraining, scope reduction, or no action;
- evaluate the proposed response before promotion.
Automatic retraining skips the diagnosis and can learn from the incident itself. Retraining this assistant would not create the missing procedures or correct their product-version metadata.
Make an Alert Open the Investigation
Every page should imply a response. “Citation quality decreased” is too vague to page anyone. An alert must say what changed, for which release, segment, workflow, and time window; what baseline makes the movement unusual; and how large, sustained, severe, or uncertain it must be before action. It names an owner and backup, points to the traces and samples an investigation may use, and states what responders may access and retain. Its playbook says what to check, contain, communicate, or escalate. Its blind-spot note names failures that could occur without moving the signal.
The assistant’s useful alert is narrower: current-product queries retrieved archived documents above an agreed rate for fifteen minutes. The content-operations owner checks ingestion freshness, product-version metadata, index construction, routing, and recent releases. The team can reach those facts through sampled, access-controlled traces. The alert cannot detect a current document whose procedure is itself wrong, so delayed resolution and correction evidence remain complementary signals.
Use hard limits for conditions that are intrinsically unacceptable, such as an unauthorized tool action. Use relative comparisons for release regressions, seasonal baselines for cyclical data, and multiple-window or burn-rate approaches when brief noise should not page an operator.
Avoid one global threshold for every segment. A rare high-impact route may need a zero-tolerance event alert, while a high-volume quality measure needs a statistically and operationally meaningful window.
Control alert fatigue through severity tiers, deduplication, dependency correlation, sensible windows, and regular deletion of alerts that never change action. Track alert precision, time to acknowledge, time to contain, repeat incidents, and playbook usefulness.
Do Not Wait for Perfect Ground Truth
Many outcomes arrive days or months later, and generative tasks may not have one objective label. The team therefore combines:
- fast proxies such as schema errors, abstention, citation support, and user correction;
- sampled human review using calibrated rubrics;
- delayed labels joined back to the release and context;
- cohort and segment outcomes;
- complaints, appeals, incident reports, and support analysis;
- periodic golden-set and adversarial regression runs.
Validate proxies against real outcomes. A thumbs-up is selective and ambiguous; no complaint can mean success, resignation, or lack of a remedy. Show uncertainty, sample size, and coverage beside the number.
When sampling outputs for review, stratify by risk, segment, uncertainty, novelty, and control outcome rather than taking only easy random cases. Keep a random component so the system can still reveal unknown failure families.
Let Evidence Move at Its Natural Speed
Different evidence moves at different speeds:
- real-time or near-real-time: outages, unauthorized actions, disclosure indicators, cost runaway, queue saturation;
- daily: release regressions, source freshness, tool failures, policy rates, reviewer load;
- weekly or monthly: sampled quality, segment outcomes, user research, appeal patterns, drift investigation;
- event-driven: model, prompt, policy, data, corpus, tool, or vendor changes;
- periodic: impact reassessment, control audit, tabletop exercise, retirement review.
Each review ends with a recorded decision: continue, investigate, change a control, expand, reduce scope, roll back, retrain, reapprove, or retire. A meeting that only looks at charts is dashboard consumption, not monitoring.
Repair the Support Assistant
The team now records release bundle, user role, language, query intent, retrieved document identifiers and dates, citation display, abstention, latency, token cost, and whether a human corrected the draft. Raw text is retained only in a restricted sampled-review store with shorter retention.
The operating dashboard separates service, corpus, retrieval, answer, safety, cost, and outcome planes. An alert fires when current-product queries retrieve archived documents above a defined rate. The playbook checks ingestion freshness, metadata, index build, product-version routing, and recent releases before changing the model.
Weekly review combines sampled groundedness, correction severity, language coverage, escalation time, and ticket resolution. A corpus migration changes the topic distribution without harming task success, so the team updates that baseline without retraining. Later, citation correctness falls only for one source type. The trace leads to a parser release, and the team rolls back that component.
The first event was different. The second was broken. Connected evidence made the distinction possible.
AI Monitoring Plan
For every monitored condition, record:
- metric or event name and operational purpose;
- system boundary, release dimensions, and affected segments;
- data source, computation, coverage, delay, and quality checks;
- baseline, threshold, uncertainty, and evaluation window;
- severity, owner, backup, notification route, and response target;
- investigation and containment playbook;
- privacy classification, access, retention, deletion, and redaction;
- dashboard and review cadence;
- known blind spots and complementary evidence;
- last test, last trigger, decision history, and retirement condition.
The plan is complete only when operators can follow an output through its release and component path; important segments and dependencies are not hidden in aggregates; delayed outcomes and sampled review can challenge fast proxies; sensitive evidence is minimized and controlled; and the review cadence produces decisions. Test the alert and playbook together. Retire either when it no longer changes action.
Try the Reasoning on Refusal Rate
Suppose refusals double. The easiest conclusion is that attacks have increased and the safety layer is working.
Segment the signal by policy category, language, release, route, and user task. In two languages, ordinary requests began triggering the classifier after a prompt-template change duplicated a caution sentence. Users were abandoning the workflow. The appropriate response is to roll back the prompt, add multilingual legitimate-use regressions, and keep the attack-rate alert separate from the refusal-experience measure.
The refusal rate did its job only when it opened the right investigation. Observability lets the team explain what changed. Monitoring commits someone to deciding what happens next. The next chapter begins when that decision is no longer routine investigation but incident response.
Source Notes
- Google Cloud, Deploy and operate generative AI applications, architecture guidance on end-to-end component lineage, service monitoring, skew, drift, alerts, and continuous evaluation for generative applications; verified 2026-07-20.
- Google Cloud Architecture Framework, AI and ML perspective: Operational excellence, official guidance on continuous performance monitoring, training-serving skew, prediction drift, observability, and intervention; verified 2026-07-20.
- NIST AI RMF Core, voluntary guidance on post-deployment monitoring, uncertainty, incident identification, feedback, and ongoing risk treatment; verified 2026-07-20.
- See Evaluating RAG and Knowledge Systems for component diagnosis and MLOps and LLMOps Foundations for release lineage.