AI Systems Handbook / Chapter 2
How Machines Learn from Data
Understand training, validation, testing, inference, generalization, and the data failures that make strong laboratory results collapse in production.
Preparing audio…
Audio edition
How Machines Learn from Data
When a 97 Percent Model Fails on Monday
A maintenance team trains a model to predict which industrial pumps need inspection. Historical records contain sensor readings, maintenance notes, and failure labels. The model reaches 97 percent accuracy on a held-out sample. The pilot looks excellent.
On Monday, production alerts surge. A sensor firmware update changed the scale of one reading. Newer pumps have different operating ranges. A timestamp feature accidentally encoded whether a record came from the period after the maintenance program improved. Rare failures were only a small fraction of the data, so the headline accuracy concealed poor detection of the cases operators cared about.
Nothing mystical happened. The model learned statistical regularities in the evidence it received, including regularities the team did not intend. The evaluation sample resembled that evidence more than the current production environment. “Learning from data” does not mean discovering timeless truth. It means fitting behavior to a particular data-generating process, objective, and set of examples.
The operating lesson is: training creates parameters; evaluation estimates whether those parameters generalize; production tests whether the assumptions still hold.
The Learning Loop
Machine learning begins by defining an instance and a task. For the maintenance team, one instance could be a pump at the end of an operating hour. Its features might include temperature, vibration, pressure, pump age, and recent maintenance. The label could be whether that pump fails within seven days. A model maps the features to a prediction; its parameters are the values adjusted during training.
Not every model consumes tidy columns. Text may be divided into tokens, images into patches, and categories into identifiers. Models often turn these inputs into embeddings: learned numeric representations in which useful relationships can become easier to fit. Tokens and embeddings change the representation, not the obligation to ask what one instance means, what evidence was available at prediction time, and what output the system must produce.
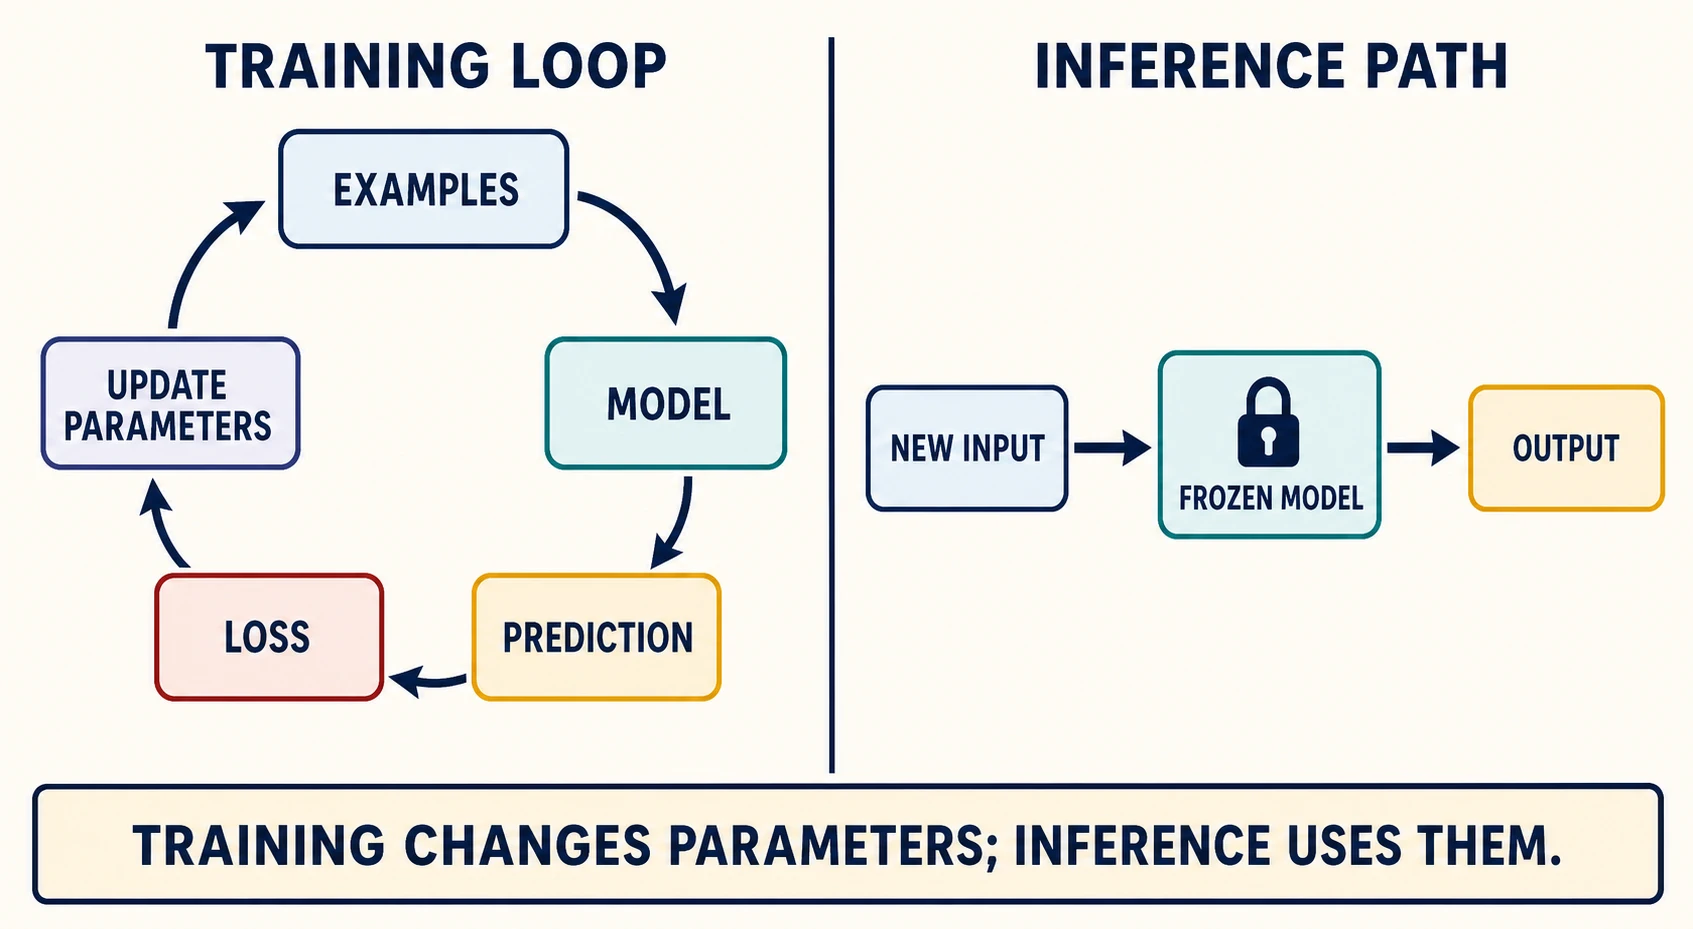
Training repeatedly compares predictions with an objective. A loss function assigns a penalty to error, and an optimization procedure changes parameters to reduce that loss over training examples. If the objective treats every pump-hour equally, the abundance of healthy hours may dominate the rare failures. The model is not discovering the maintenance team’s intent. It is fitting behavior shaped by the data, representation, architecture, objective, and optimization the team supplied.
Inference is different. A deployed model receives a new input and uses its learned parameters to produce an output. Ordinary inference does not retrain the model. Feedback collected after inference may enter a later training process, but that is a separate, governed pipeline.
Four Ways to Learn
The learning setup determines what evidence the system can use and what failure modes deserve attention.
| Learning setup | Evidence | Typical use | Central risk |
|---|---|---|---|
| Supervised | Inputs paired with labels | Classification, regression, ranking | Labels may be wrong, biased, delayed, or leaked. |
| Unsupervised | Inputs without task labels | Clustering, representation, anomaly discovery | Patterns may not correspond to useful or legitimate categories. |
| Self-supervised | Targets derived from the data itself | Language and multimodal representation learning | Scale does not guarantee factuality, coverage, or appropriate downstream behavior. |
| Reinforcement learning | Rewards from interaction or feedback | Sequential control, policy optimization | The reward may be exploited or omit important consequences. |
These setups can be combined. A foundation model may be pretrained with self-supervision, adapted with labeled examples, and further shaped by preference or reinforcement signals. A production system may then add retrieval, deterministic policies, and human review. Saying that such a system “learned from feedback” conceals several distinct datasets, objectives, and decisions. Each link in that evidence chain can fail differently.
Data Is a Measurement Process
Rows and labels are not neutral pieces of reality. They were produced by sensors, interfaces, policies, workers, customers, incentives, and historical conditions.
For the pump model, “failure” may mean a technician created a particular work order. Pumps inspected frequently produce more documented faults. A missing sensor value may indicate a network problem correlated with an older facility. Maintenance notes may contain the eventual diagnosis, creating leakage if those notes would not exist at prediction time. The dataset therefore represents a process of observation and intervention, not simply the pumps.
Before training, write a data-generation account:
- What real-world event creates an instance?
- Which information exists at the moment of prediction?
- Who or what supplies the target label?
- What cases never enter the dataset?
- Which policies changed during the collection period?
- How might deployment change future data?
Try this before reading on: for the pump pilot, decide exactly when one prediction is made, which readings exist then, and what event deserves the label failure. Would a technician’s work order count? What about an automatic shutdown, a replaced seal, or a failure prevented by inspection?
The answers change the dataset. A work-order label measures a maintenance process as well as pump condition. Frequently inspected pumps produce more documented faults. An automatic shutdown may be recorded by a different system. Prevented failures may never appear as failures at all. Proxies such as work orders, clicks, completed repairs, manager ratings, or historical approvals encode the institutions that produced them. A model can fit the proxy while degrading the outcome the team actually wanted.
Train, Validate, Test, Then Watch Production
The training set fits parameters. The validation set supports choices such as features, model class, hyperparameters, and thresholds. The test set is reserved for a final estimate after those choices. Production data is not a fourth interchangeable sample; it is the live environment whose distribution and behavior may differ.
Repeatedly tuning decisions against the test set makes it function like validation data. Duplicate entities across splits can leak identity or near-identical content. Random splitting can be misleading when the actual task predicts the future, a new geography, a new customer, or a new device. Split logic should match the intended generalization boundary.
Useful strategies include time-based splits for forecasting, group-based splits that keep one person’s or device’s records together, geography holdouts, and challenge sets targeting rare but consequential cases. No split removes the need for production monitoring.
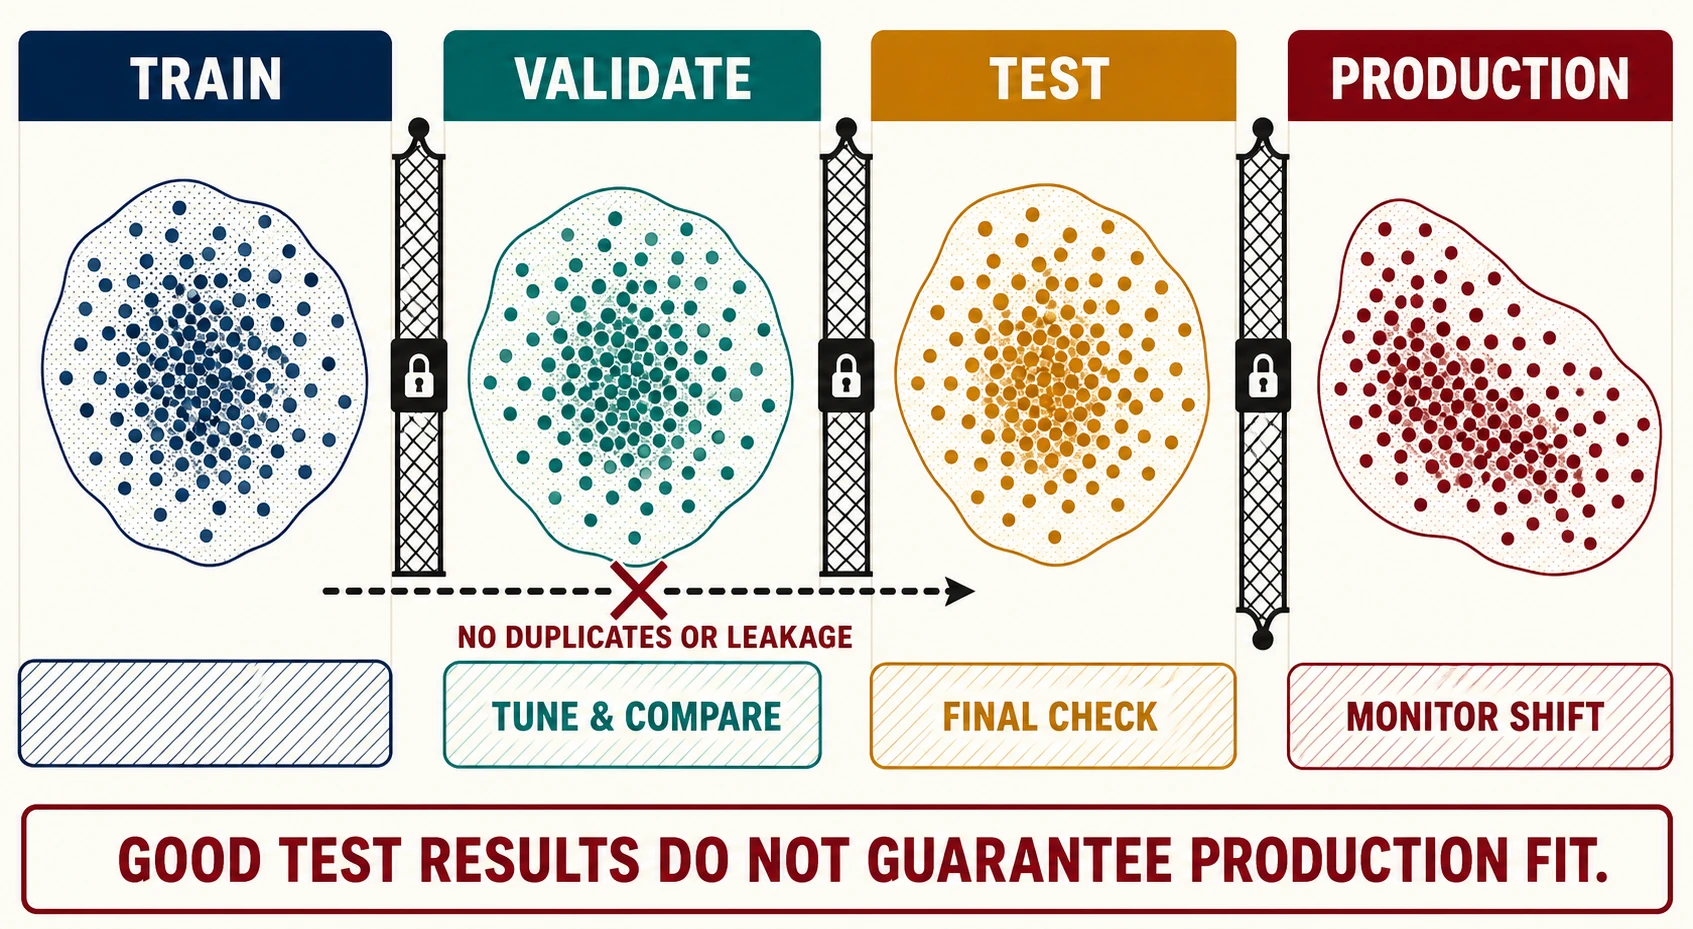
The important property is not a fixed split percentage but decision independence. Evidence used to choose a model is weaker evidence for estimating how that choice performs on genuinely unseen cases. Google’s Machine Learning Crash Course therefore recommends distinct training, validation, and test sets and warns against duplicates, unrepresentative test data, and repeated decisions against the same test set.
Generalization, Overfitting, and Leakage
Generalization is acceptable performance on relevant cases not used to fit or choose the model. Overfitting occurs when behavior tracks peculiarities of development data more closely than the intended pattern. Leakage occurs when information unavailable at decision time, or information derived from the target, enters training or evaluation.
Common leakage paths include:
- preprocessing all data before splitting, so test statistics influence training;
- placing records from the same customer, patient, device, or document in multiple splits;
- using a field created after the predicted event;
- allowing future information into a forecasting feature;
- tuning prompts, features, or thresholds against the final test set;
- including benchmark or evaluation examples in adaptation data.
Overfitting is not cured only by reducing model size. More representative data, regularization, simpler features, robust split design, challenge cases, and honest objectives can all matter. A complex model can generalize; a simple one can exploit leakage.
Reconstruct the Monday Failure
The 97 percent result can now be taken apart. Start with the timestamp. If it marks records collected after the maintenance program improved, it partially reveals the operating regime and therefore the likelihood of failure. A random split distributes that shortcut across training and test data. The score rewards the model for recognizing a collection period that will not identify future failures reliably.
Next, the split may put hours from the same pump on both sides. Neighboring sensor windows are similar enough for the test set to resemble material the model has already fitted. Grouping by pump would ask the harder question: can the model generalize to equipment it has not seen? Holding out the newest period would ask whether it can generalize across time. Holding out the new pump family or updated firmware would expose another boundary. These are different claims, so they need different tests.
Then examine the 97 percent itself. If failures occupy only a small fraction of pump-hours, average accuracy may mostly describe healthy operation. The team must measure the failures and false alarms separately, across pump families, facilities, firmware versions, and operating ranges. Chapter 3 develops those metric choices; here the point is that the evaluation population must contain the cases the claim is about.
Finally, follow the model into work. An alert consumes an inspector’s time, and a missed alert can damage equipment. The safer initial system ranks inspections or proposes a review rather than silently scheduling maintenance. Operators can correct a recommendation, but those corrections enter a reviewed labeling queue instead of retraining the model automatically. The data owner governs the labels, the model owner governs releases, and maintenance owns the consequences and the authority to fall back.
What the Team Must Prove
Falling training loss proves only that optimization changed the model in the direction encoded by its objective. Release evidence has a longer chain.
The team must first defend the data: its provenance and rights, how instances and labels were produced, which populations and conditions it covers, and where coverage is thin. It must then defend the split as a test of the stated boundary—new time, pump, facility, firmware, or some deliberate combination—without duplicates or linked records crossing that boundary.
On that evidence, the model must beat the current inspection process and a useful simple baseline. Results must hold for consequential segments and rare conditions, not merely on average. The workflow must handle uncertainty, overload, correction, and escalation under realistic staffing. In production, drift, quality, workload, and maintenance outcomes need thresholds, owners, and a tested fallback.
A learned system that barely improves average performance while increasing inspection burden, delay, or unequal coverage has not made the maintenance program better.
Failure Modes and Controls
Label shortcut: the target reflects an administrative process rather than the desired outcome. Control it with construct review, annotator guidance, disagreement analysis, and domain-owner approval.
Coverage gap: important populations, devices, languages, or rare events are absent. Control it with segment inventory, targeted collection, conservative scope, and explicit unsupported-use rules.
Distribution shift: inputs or target relationships change. Control it with feature and outcome monitoring, periodic reassessment, fallback, and retraining triggers.
Feedback loop: model outputs influence future labels, making the system appear correct. Control it with independent sampling, exploration where appropriate, human audit, and causal caution.
Automation bias: reviewers accept predictions without adequate scrutiny. Control it with calibrated presentation, evidence, training, sampled blind review, and measured override quality.
Unowned retraining: new data changes behavior without review. Control it with dataset and model versions, evaluation gates, approval records, release notes, and rollback.
Trace Your Own Learning Claim
Take a proposed machine-learning feature and write one paragraph that names the instance, prediction moment, features, label or feedback signal, output, and downstream action. Then try to break the claim:
- Document where every feature and label originates and when each becomes available.
- State the generalization claim: new time period, person, device, geography, language, or case.
- Choose splits that test that claim; remove duplicates and linked entities across boundaries.
- Keep the final test evidence independent of model and threshold selection.
- Compare against the current process and a simple baseline.
- Report error costs and performance by relevant segment, not only an average.
- Test uncertainty, abstention, human correction, fallback, and workload impact.
- Version data, transformations, model, thresholds, and release evidence.
- Monitor production drift, outcomes, complaints, corrections, and unintended feedback loops.
If the proposal cannot answer these questions, “trained” and “validated” are descriptions of pipeline activity, not evidence that the system will work.
Evidence is produced by a process. Training fits behavior to it. Evaluation tests a specific generalization claim. Deployment changes the environment, and monitoring reveals whether the claim still holds.
Once the learning claim is sound, Prediction, Classification, Ranking, Recommendation, and Forecasting connects each output shape to the metrics and error costs that govern its use.
Source Notes
- Google Machine Learning Crash Course: Dividing the original dataset, guidance on train, validation, and test separation, duplication, representativeness, and evaluation-set wear; verified 2026-07-19.
- Google Rules of Machine Learning, practical guidance on baselines, data pipelines, training-serving consistency, and production iteration.