AI Systems Handbook / Chapter 3
Prediction, Classification, Ranking, Recommendation, and Forecasting
Match predictive task types to output shapes, error costs, thresholds, uncertainty, and acceptance criteria that reflect real decisions.
Preparing audio…
Audio edition
Prediction, Classification, Ranking, Recommendation, and Forecasting
Accuracy Is Not a Product Requirement
A fraud team receives a model advertised as 99.4 percent accurate. Fraud occurs in 0.4 percent of transactions. A system that labels every transaction legitimate is 99.6 percent accurate and catches nothing.
The headline number concealed the decision. Is the score meant to block a purchase, request another form of authentication, or order a queue for investigators? Blocking a legitimate card purchase creates customer harm. Sending it to review consumes scarce attention and delays the customer. Missing fraud creates financial loss and may expose the customer to further abuse. The same model can be useful under one policy and unacceptable under another.
Predictive AI is useful only when three layers agree: the output shape, the decision policy, and the evaluation evidence. Classification, regression, ranking, recommendation, forecasting, clustering, and anomaly detection are not interchangeable labels. They produce different objects and require different tests.
Those tests remain credible only when the data split and generalization claim are sound; review How Machines Learn from Data before interpreting any metric result.
Name the Output Before the Metric
Classification assigns one or more categories. Binary classification might produce fraud or not fraud; multiclass classification might route a request among departments; multilabel classification might tag a document with several topics. In practice, a classifier commonly emits a score for each category, and later policy turns those scores into labels or actions.
Regression estimates a numeric value such as delivery duration, energy usage, claim amount, or remaining component life. Ranking orders candidates, often for search or prioritization. Recommendation selects and orders options for a user or context. Forecasting estimates a future quantity across time, ideally with uncertainty. Clustering groups examples by similarity without a predefined target. Anomaly detection identifies unusual cases relative to an expected pattern.
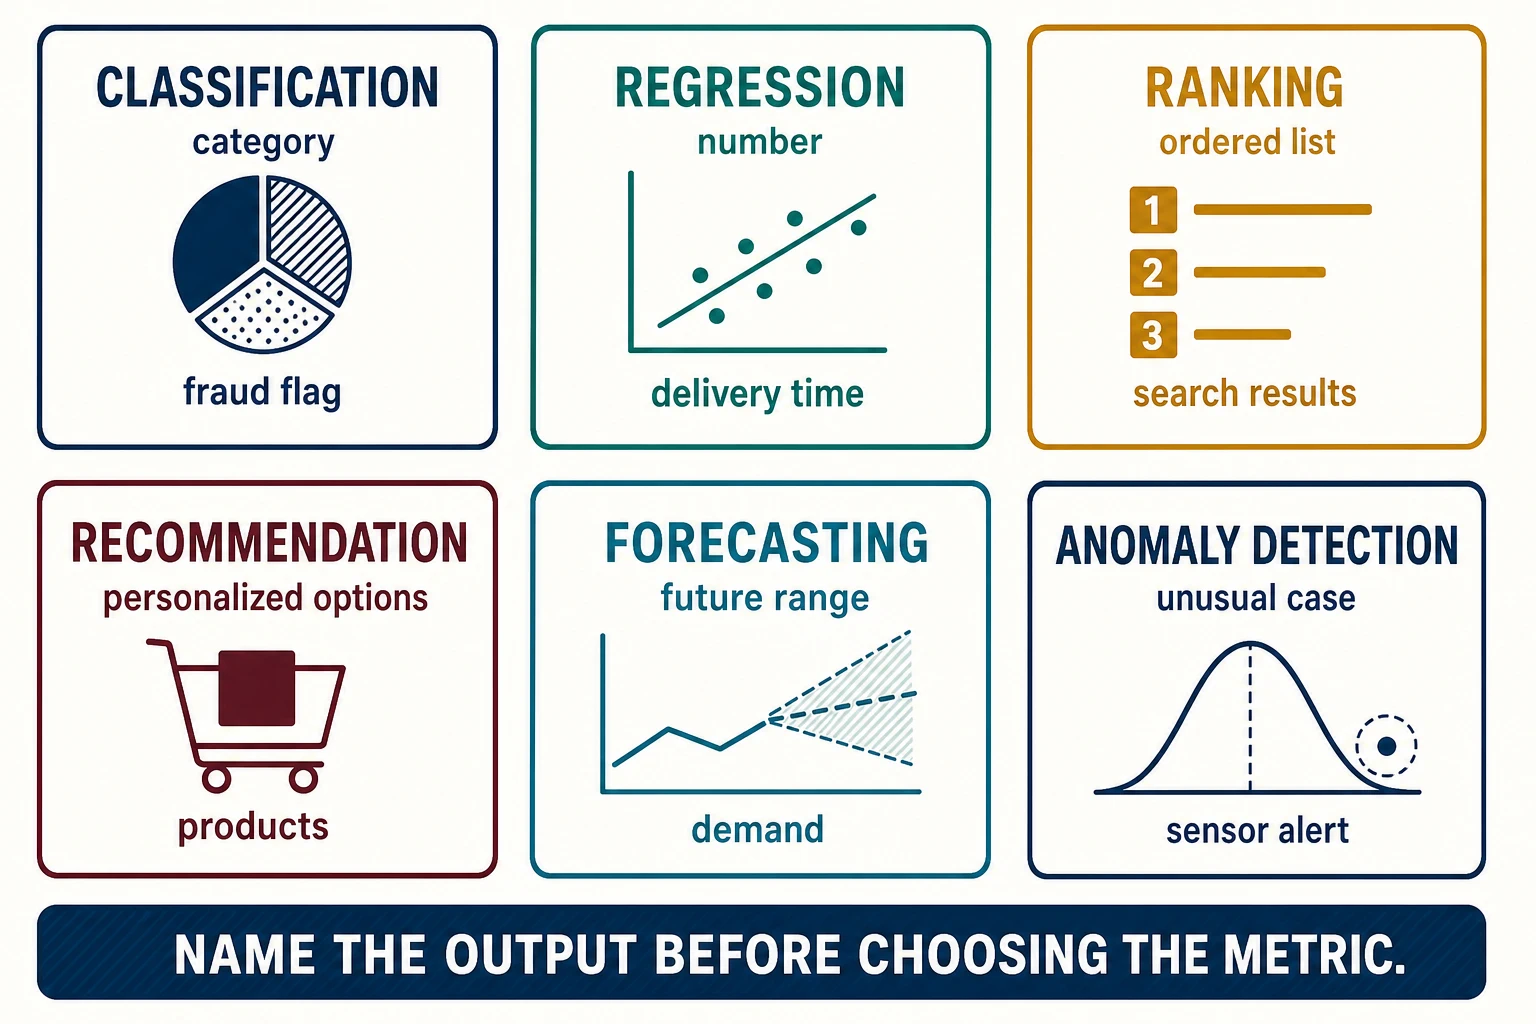
Problem formulation can change without changing the business goal. Fraud review might use binary classification, anomaly detection, a ranked review queue, or an expected-loss estimate. The right formulation depends on action capacity, label quality, timing, and error cost.
Classification Creates Four Outcomes
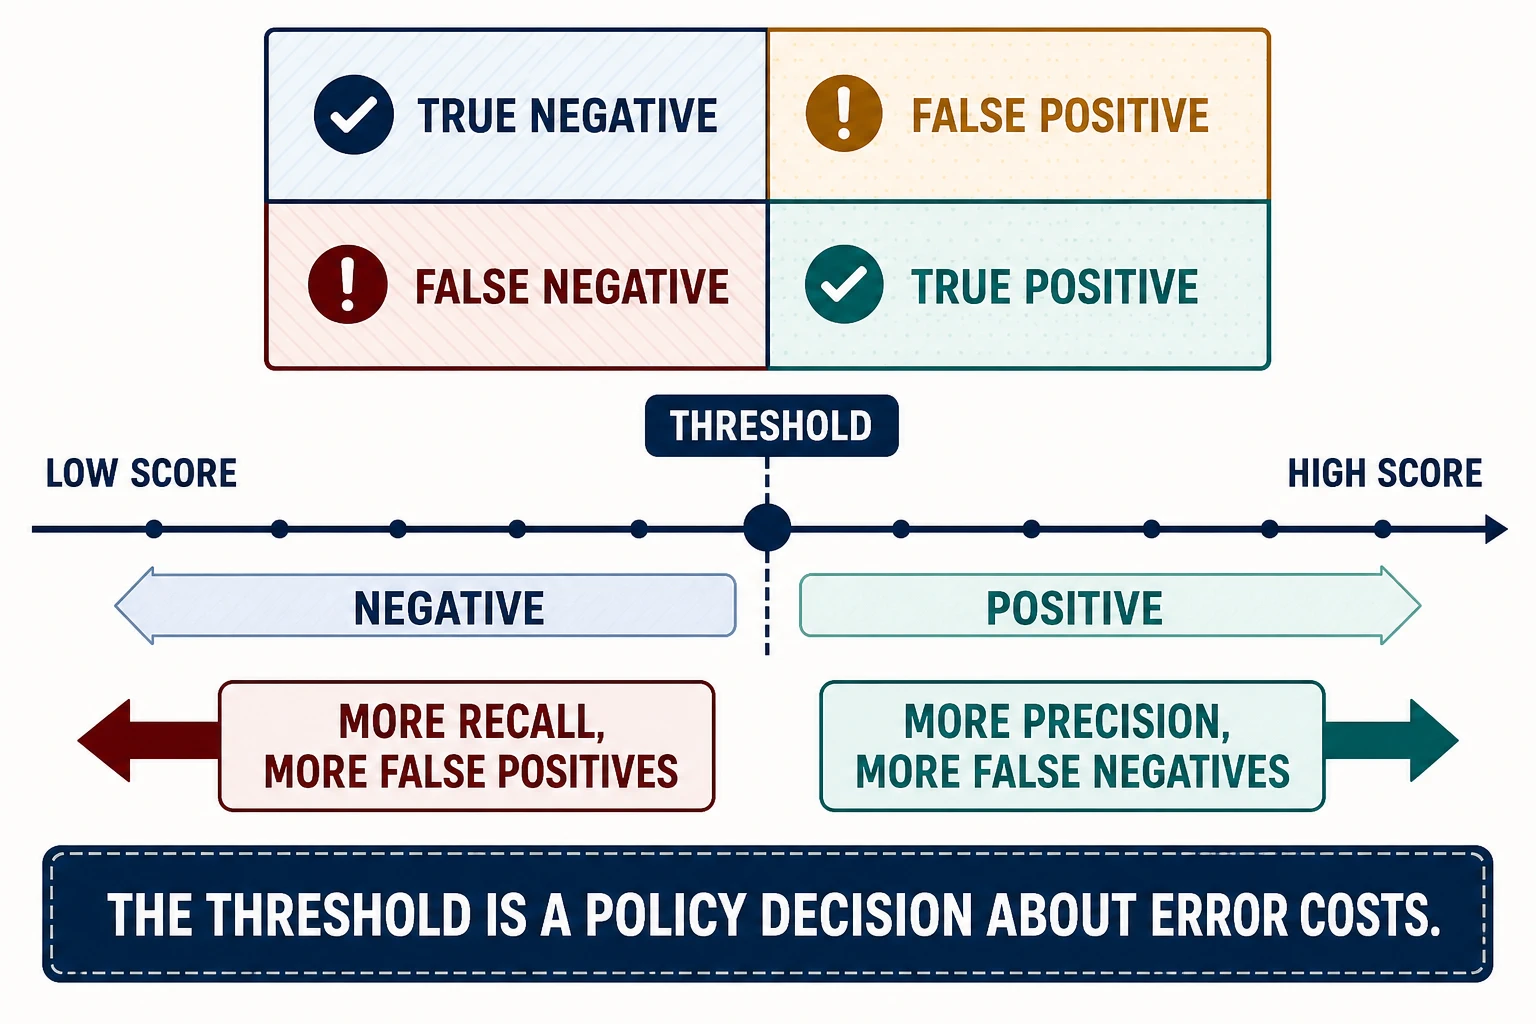
A binary classifier usually produces a score, not an action. A threshold converts that score into positive or negative. Comparing that decision with the observed outcome yields four cells:
- true positive: predicted positive and actually positive;
- false positive: predicted positive but actually negative;
- true negative: predicted negative and actually negative;
- false negative: predicted negative but actually positive.
Suppose the team evaluates 100,000 transactions containing 400 confirmed fraud cases. At one threshold, the system catches 300 of them and wrongly flags 400 legitimate purchases. It therefore has 300 true positives, 400 false positives, 99,200 true negatives, and 100 false negatives.
Accuracy is (TP + TN) / all cases, which is 99.5 percent here and still sounds reassuring. Precision is TP / (TP + FP): when the system predicts fraud, how often is it right? Here it is about 43 percent. Recall is TP / (TP + FN): of all confirmed fraud, how much did it find? Here it is 75 percent. Specificity is TN / (TN + FP): of legitimate transactions, how many did it leave alone? Here it is 99.6 percent.
No one of those figures settles the release decision. If every flagged purchase is blocked, 400 false positives may be intolerable. If every flag enters a well-staffed review queue, the same precision may be workable. If the missed fraud is concentrated in a vulnerable customer segment, the aggregate recall conceals the most important failure. Metric choice depends on the task, class balance, misclassification cost, threshold, and action. A production system usually needs minimums for several measures, plus capacity and fairness constraints.
The Threshold Is Policy
Suppose the fraud score ranges from 0 to 1. Lowering the threshold catches more fraud, increasing recall, but also flags more legitimate purchases. Raising it reduces false alarms but misses more fraud. The model supplies an ordering signal. The organization chooses what happens at each point on that ordering.
A threshold decision record should include:
- the score and model version;
- the action triggered at each threshold or band;
- false-positive and false-negative consequences;
- review capacity and service-level limits;
- segment performance and protected constraints;
- calibration evidence;
- rollback and reassessment triggers;
- the owner authorized to accept the trade-off.
Use bands when one cutoff hides useful options. Low-risk transactions can proceed, a middle band can receive additional authentication or human review, and a high-risk band can be blocked. Review capacity belongs in this design: a threshold that produces 12,000 daily referrals for a team able to inspect 2,000 is not an operating point. It is an unmanaged backlog. The workflow, not only the metric, determines value and harm.
Calibration and Uncertainty
Ranking quality and confidence quality are different. A model can rank positive cases above negative ones while assigning scores that should not be read as probabilities. Calibration asks whether predicted confidence corresponds to observed frequency in similar cases. If cases scored near 0.8 are positive roughly 80 percent of the time in the relevant population, the score is calibrated there.
Calibration can degrade by segment or over time. A risk score calibrated for one geography, season, or device may mislead elsewhere. Never present a model score as certainty. Test reliability across operationally relevant bands and segments, and distinguish model uncertainty from missing information, ambiguity, and future volatility.
Abstention is a valid output. A model may defer when evidence is insufficient, inputs are out of scope, confidence is poorly supported, or policy requires human judgment. Evaluate whether the system abstains on the right cases and whether the escalation path can absorb the volume.
Clusters and Anomalies Need Interpretation
Clustering and anomaly detection often begin without the target labels used in supervised classification. A cluster is a group produced by a chosen representation and similarity rule; it is not automatically a real-world type. An anomaly is unusual relative to a reference population; it is not automatically fraud, failure, or harm.
That distinction changes the evaluation. A customer cluster is useful only if it is stable enough, interpretable enough, and relevant to a legitimate action. An anomaly detector should be tested against known incidents where labels exist, but also against alert volume, time to detection, repeated false alarms, and novel cases reviewed by domain experts. Changing the features, distance measure, time window, or comparison population can change what appears unusual.
The fraud team might use anomaly detection to surface a new pattern that its labeled classifier has never seen. Investigators still need evidence before treating those transactions as fraud. The detector proposes where to look; the workflow determines what the signal is allowed to mean.
Ranking and Recommendation Need Position-Aware Evidence
Ranking systems do not merely classify items as relevant or irrelevant. They decide which options appear first, which are buried, and which are never seen. Evaluation therefore cares about position.
Precision at k asks how many of the first k results are relevant. Recall at k asks how much of the relevant set appears in those positions. Mean reciprocal rank rewards placing the first relevant result early. Normalized discounted cumulative gain gives more credit to highly relevant results near the top and can handle graded relevance.
Recommendation adds personalization, repeated exposure, discovery, inventory, and feedback loops. Click-through rate is not a complete objective: clicks can reward sensational items, already-popular products, or manipulative placement. Add measures of task completion, satisfaction, diversity, coverage, novelty, complaint rate, downstream value, and harm. Use counterfactual or experimental reasoning carefully because the system controls what users get a chance to choose.
A search team should separate at least four questions:
- Did retrieval find eligible candidates?
- Did ranking order useful candidates well?
- Did the interface help the user complete the task?
- Did repeated exposure create harmful concentration or exclusion?
Regression and Forecasting Require Error Shape
Mean absolute error expresses average absolute distance from the observed value in the target’s units. Root mean squared error penalizes large misses more heavily. Percentage errors can become unstable near zero and can weight cases in surprising ways. A single average hides whether errors are systematically high, low, seasonal, or concentrated in critical segments.
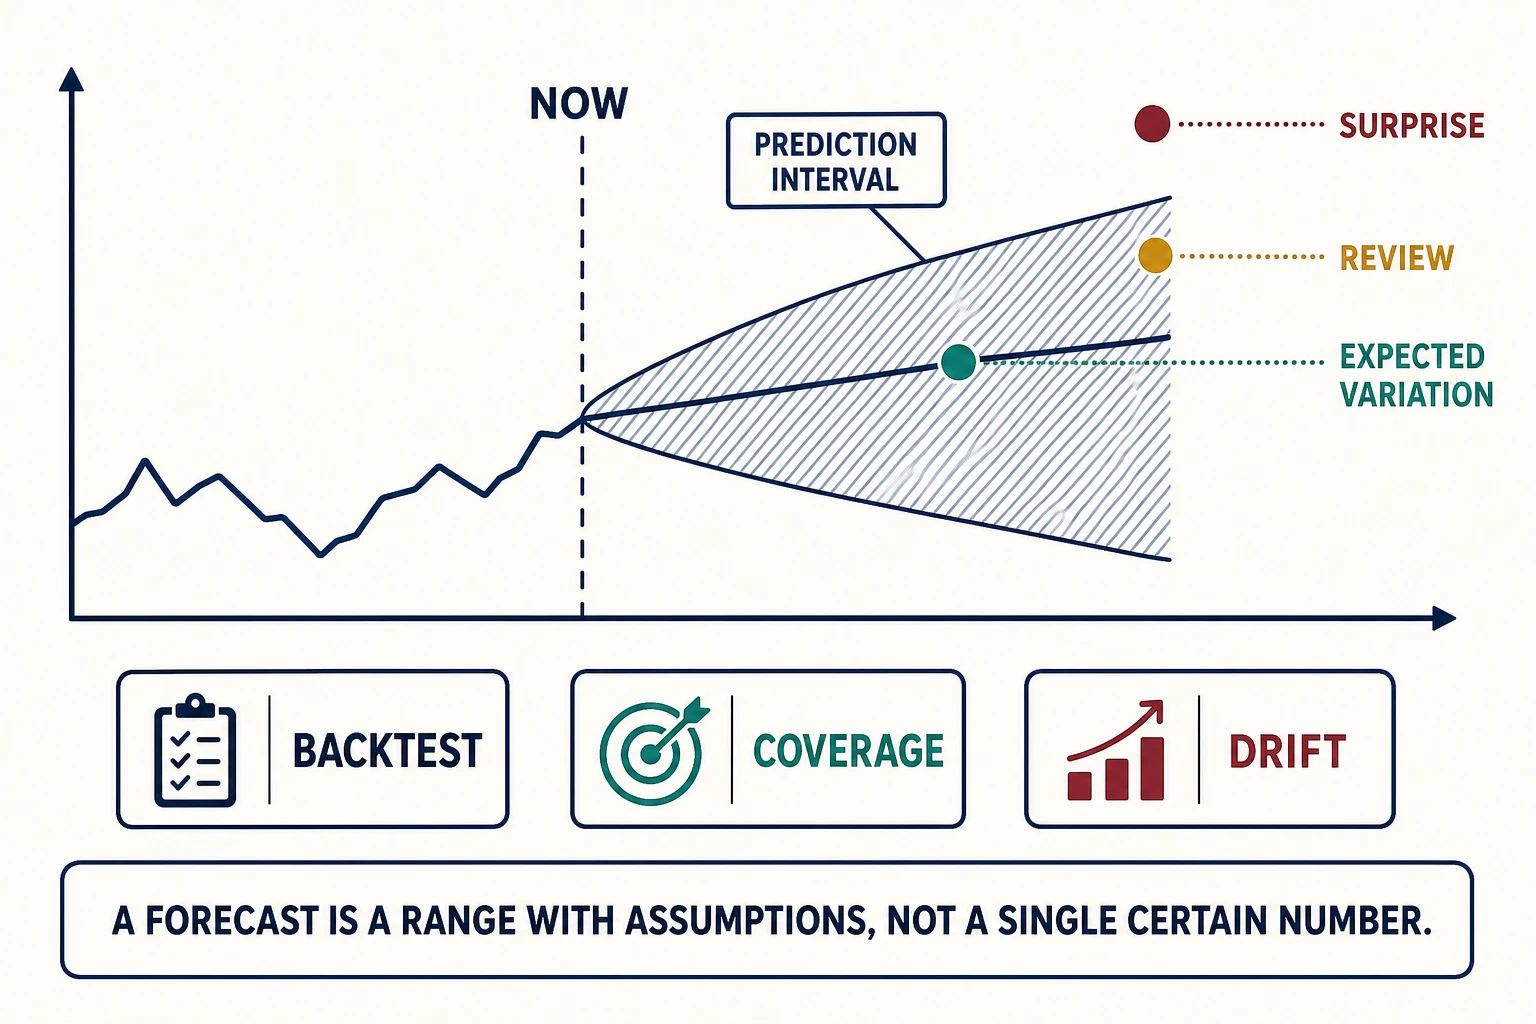
Forecasting adds time. Randomly splitting time-series observations can leak future conditions into the past. Backtesting simulates repeated historical prediction points: train using information available then, predict a future horizon, compare with what happened, and move forward. Evaluate by horizon, season, regime, geography, or business segment.
A forecast should include a prediction interval or quantiles, not only a point. Coverage measures how often observed values fall within the stated interval. A very wide interval may have good coverage but little decision value; a narrow interval may look precise but miss too often.
Make the Decision Before Choosing the Metric
Consider four proposed systems before reading the decisions below. For each one, name the output, the action, the error that matters most, and the capacity limit. There is no context-free best metric.
Invasive-species detection. The output is a class score from a submitted image. Missing a true sighting is costly; a trained expert can cheaply dismiss a false alarm, up to the point where volume overwhelms the review team. Require high recall above an image-quality gate, monitor false-alarm workload, and keep human confirmation before public action.
Loan-document triage. The model routes incomplete applications for manual review; it does not decide eligibility. Measure recall for missing critical documents, precision to protect review capacity, processing delay, segment performance, and correction rate. The less consequential task creates a safer boundary than automated approval.
Product search. The output is an ordered list and the action is exposure: some products become visible while others disappear below the fold. Evaluate recall at candidate retrieval, position-aware relevance, successful purchase or task completion, latency, diversity, inventory constraints, and complaint or return signals. A conversion-only objective may favor expensive or familiar items while making the catalog less useful.
Hospital staffing forecast. A point estimate is inadequate. Produce intervals by horizon, backtest across seasonal peaks, measure underforecast and overforecast costs separately, and document how staffing leaders combine the forecast with planned events and clinical judgment.
The same word—prediction—covers four different evidence and control designs. If your first answer to any of these cases was “accuracy,” revise it until the measure names the decision consequence it protects.
Write an Acceptance Rule
For any predictive proposal, write one decision record rather than a loose collection of metric targets. Begin with the unit and prediction moment: what exactly is one case, and what information is available then? Name the output—a category, number, score, ordered list, range, cluster, or anomaly—and then name the action separately.
Describe the current process and a simple baseline. For each kind of error, identify who bears the consequence and whether the action is reversible. Choose a primary measure that reflects the dominant cost, then add explicit floors or ceilings for safety, fairness, latency, expense, and workload. State where aggregate performance must be broken down by segment.
Finally, record who owns the threshold or ranking policy, how the system represents uncertainty or abstains, what production outcomes reveal drift or goal gaming, and what condition forces reassessment or rollback. If the decision record cannot name an owner or a stopping condition, the metric has no operational authority.
An acceptance rule might read: “Launch only if fraud recall exceeds the agreed minimum on the time-based test set, legitimate block rate stays below the segment-specific ceiling, calibration error remains within tolerance, manual review fits staffed capacity, and a four-week shadow pilot shows no unresolved high-severity failure.” This is more useful than “accuracy above 95 percent” because it describes a decision.
Failure Modes That Survive Good Scores
Metric substitution: optimizing an easy proxy such as clicks instead of the user outcome. Counter it with an outcome map and multiple measures.
Average-performance masking: strong aggregate results hide failure in a language, region, device, or affected group. Counter it with predeclared segment analysis and minimum floors.
Threshold drift: a once-appropriate cutoff becomes harmful as prevalence, review capacity, or costs change. Counter it with calibration monitoring and policy review triggers.
Selective labels: outcomes are observed only for cases the system acted on. Counter it with audit samples, careful experimental design, and explicit uncertainty about unobserved outcomes.
Feedback concentration: ranking and recommendation amplify popular items and reduce exposure for alternatives. Counter it with exploration, diversity and coverage measures, supplier or creator analysis, and long-term user outcomes.
False precision: a forecast point or probability is treated as certainty. Counter it with intervals, calibration, assumptions, decision bands, and abstention.
Return to the fraud model advertised as 99.4 percent accurate. The useful questions now sound different: What action follows each score band? How many legitimate purchases are delayed or blocked? Which fraud remains undetected, for whom, and at what cost? Can review staff absorb the middle band? Do the scores remain calibrated as transaction patterns change? Who can move the thresholds, and what evidence permits that change?
“How accurate is the model?” has become a smaller question inside the one that governs the system: given this output, policy, workflow, population, and error cost, what evidence justifies the action?
Source Notes
- Google Machine Learning Crash Course: Accuracy, recall, precision, and related metrics, threshold-sensitive metric definitions and imbalanced-data guidance; verified 2026-07-19.
- Google Machine Learning Crash Course: ROC and AUC, interpretation of classifier behavior across thresholds; verified 2026-07-19.