AI Systems Handbook / Chapter 26
Metrics for Predictive Models
Choose predictive-model metrics, thresholds, and segment gates from the consequences of errors rather than dashboard convention.
Preparing audio…
Audio edition
Metrics for Predictive Models
A Better Score Created a Worse Queue
A hospital operations team replaces a triage model that had 86% accuracy with one reporting 93%. The new model looks superior until nurses inspect the queue. It misses more of the rare cases that require urgent escalation, and the apparent improvement comes from correctly classifying more routine cases. The score rose while the decision became less safe.
The arithmetic is sound. The measurement design is not. Accuracy has assigned the same value to a missed urgent case and a correctly deferred routine case, although the workflow cannot.
A metric is a compressed statement about what counts as success. Choose it from the decision and its error consequences, then choose the threshold; never let a convenient score define the product.
Name the Decision Before Counting Success
The team is not deciding whether a model can label records. It is deciding which patients enter an urgent-review queue with limited nursing capacity. An urgent prediction creates review and possible intervention. A missed urgent case may delay care. An unnecessary escalation consumes attention and can delay everyone else. Both errors matter, but they are neither interchangeable nor equally recoverable.
Before choosing a measure, write down the prediction unit, time horizon, action, affected people, fallback, and receiving capacity. Ask what a positive prediction causes, who bears each error, how quickly it can be detected or repaired, and which patient groups require their own performance floors. This description determines whether the output must be treated as a class, a probability, a score, an amount, an ordered list, or a forecast.
A spam filter, screening aid, recommender, revenue forecast, and search ranker should not inherit the same favorite metric merely because one software library exposes all of them.
The Four Cells Are Four Consequences
For binary classification, every evaluated prediction occupies one cell:
| Actually urgent | Actually routine | |
|---|---|---|
| Sent to urgent review | True positive (TP) | False positive (FP) |
| Left in routine flow | False negative (FN) | True negative (TN) |
The matrix earns its space because every common classification rate selects a different denominator:
- Accuracy,
(TP + TN) / all cases, asks how often the class was correct. - Precision,
TP / (TP + FP), asks how often an urgent alert was right. - Recall or sensitivity,
TP / (TP + FN), asks how many urgent cases were found. - Specificity,
TN / (TN + FP), asks how many routine cases stayed out of the urgent queue. - F1, the harmonic mean of precision and recall, balances those two rates but assigns no explicit cost to their errors and ignores true negatives.
For the triage team, recall describes missed need; precision describes how concentrated that need is in the queue. Neither describes the whole operation. A high-recall model can flood nurses with false alarms, while a high-precision model can leave too many urgent patients behind.
Publish counts beside rates. “Recall is 90%” could mean that the model found 9 of 10 urgent cases or 9,000 of 10,000. The rate is the same; the uncertainty and evidence are not. Counts also expose workload because TP + FP is the number of cases the model sends to review.
Class imbalance explains the deceptive accuracy. If urgent cases are rare, a model can gain many correct routine classifications while losing several urgent ones. A model that always predicts “routine” may be highly accurate and clinically useless. Compare against that trivial baseline, but do not stop there: inspect the four counts and the consequences at the proposed operating point.
The Threshold Writes Queue Policy
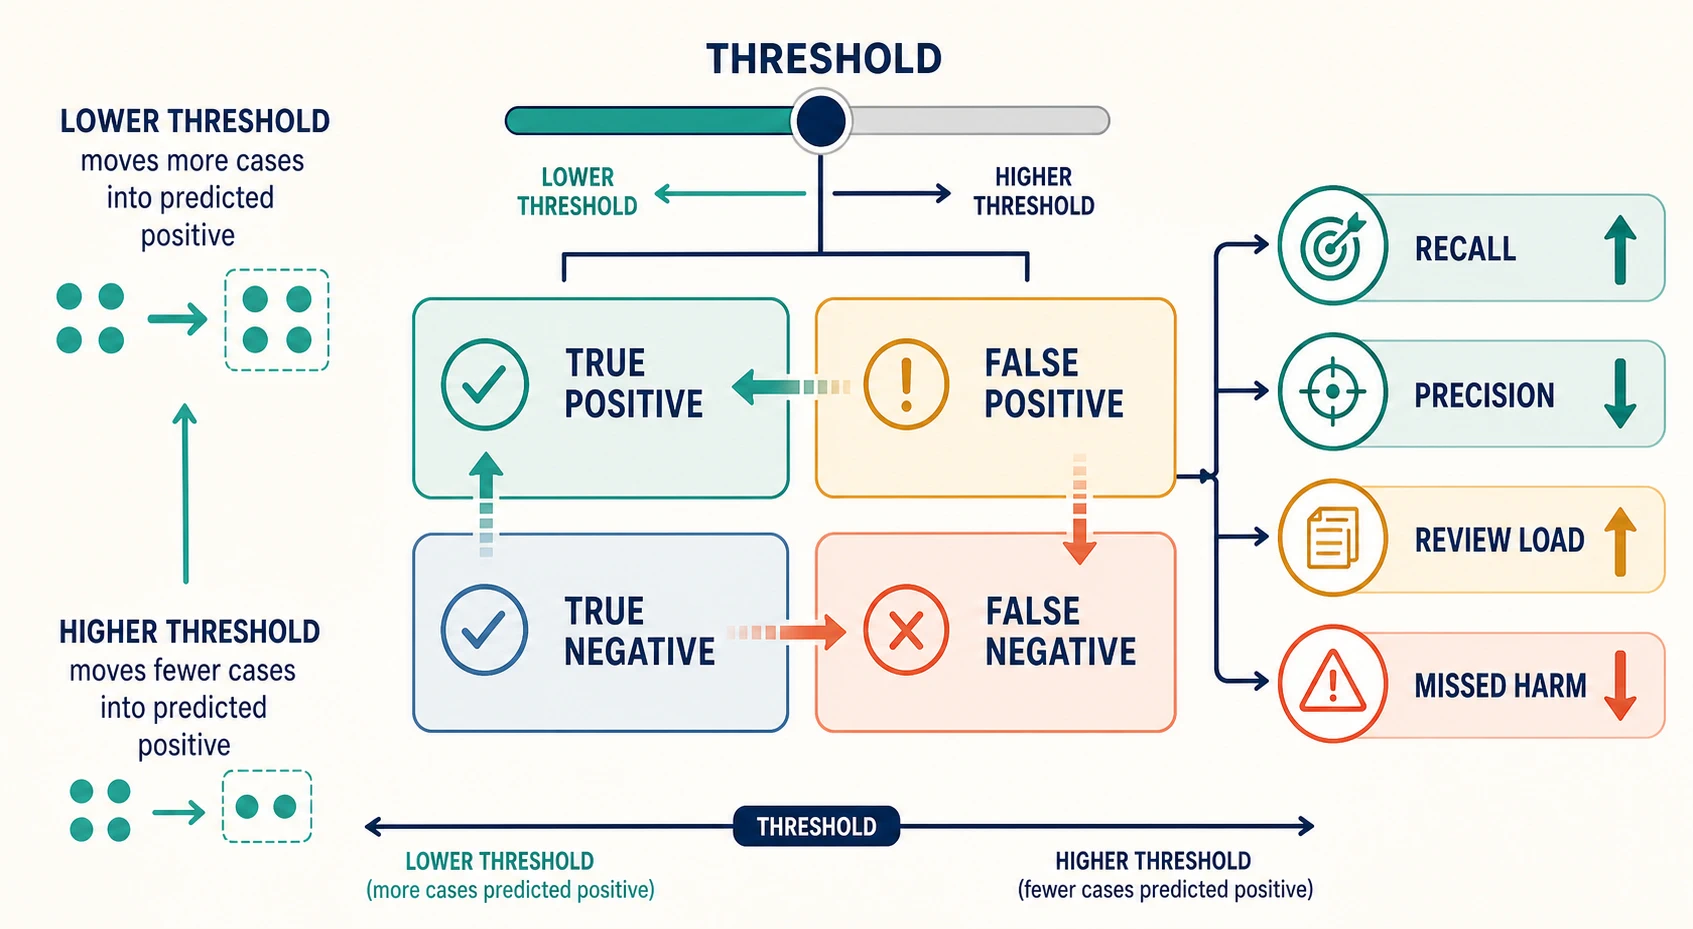
The classifier emits a score; the threshold turns it into an action. Lowering the threshold usually retrieves more urgent cases and sends more routine cases to review. Raising it usually relieves the queue and misses more urgent cases. There is no threshold-free claim of “93% accurate” that can settle this choice.
ROC curves plot true-positive rate against false-positive rate across thresholds. ROC-AUC summarizes how well scores rank positives above negatives across that range. It does not choose an operating point, describe calibration, or show the workload at the point the team will deploy. With a rare positive class, a small false-positive rate can still produce a large queue.
A precision-recall curve keeps attention on the positive class. PR-AUC is therefore often more informative for rare-event retrieval, but it also averages across operating points the system will never use. For release, return to the confusion matrix at a particular threshold.
The team selects candidate thresholds on representative validation data. For each one it calculates urgent cases found, urgent cases missed, daily review volume, segment results, and uncertainty. It then chooses an operating point that satisfies a recall floor without exceeding safe queue capacity. The threshold is locked before the final release evaluation; otherwise the release set quietly becomes tuning data.
When prevalence, staffing, downstream procedure, or error severity changes, the policy has changed even if the model has not. The threshold and its evidence must be reviewed again.
A Risk Score Must Earn Its Probability Language
The queue may rank patients by score, but a score of 0.8 is not automatically an 80% probability. A model can order higher-risk cases above lower-risk ones while overstating or understating their absolute risk.
A reliability diagram groups predictions into score ranges and compares their predicted probabilities with observed frequencies. Proper scoring rules such as log loss or the Brier score also assess probabilistic predictions rather than only their final classes. Any calibration layer is fitted without using the data reserved to evaluate the combined pipeline.
Calibration belongs to a population and period. If referral patterns change, a previously calibrated 0.8 may no longer mean what nurses were taught it means. Recheck it when probabilities govern resource allocation, risk bands, pricing, alerts, or human reliance. When a product needs only a fixed ranking, discrimination may matter more, but the interface should call the output a score rather than borrow the authority of probability.
Other Outputs Change the Question
The same consequence-first method applies when there is no confusion matrix.
For a continuous prediction, mean absolute error (MAE) keeps error in the target’s units and weights each unit linearly. Root mean squared error (RMSE) gives large errors greater influence. Mean absolute percentage error (MAPE) is easy to repeat in a meeting but behaves badly when actual values approach zero. A demand forecast can have an acceptable average and still fail badly for stockout-sensitive products, so report the error distribution, bias, important segments, and horizons as well as a summary.
Forecasts also require time-aware backtesting. Preserve temporal order, test across multiple forecast origins, and compare with seasonal or “last value” baselines. A random split can allow future conditions to inform the apparent past.
For ranked outputs, choose a measure that resembles the experience. Recall@k asks how much relevant material appeared among the first k items. Hit rate asks whether at least one relevant item appeared. Mean reciprocal rank rewards placing the first relevant result early. Normalized discounted cumulative gain gives more credit when highly relevant items appear near the top. None establishes user benefit on its own. Coverage, diversity, novelty, latency, exposure, and downstream outcomes may be part of the actual decision, and click logs describe only items the old system chose to show.
The names differ, but the discipline is the same: identify what the output causes, then measure the success and failure the system can create.
Cost and Segments Belong in the Release Gate
The triage team now writes consequences before collapsing anything into a score. A missed urgent case has high severity, low immediate detectability, and difficult recovery. An unnecessary escalation is usually visible and recoverable, but it consumes capacity. A correct escalation creates the benefit the system exists to deliver. Monetary prices would imply false precision, so the team uses severity, detectability, recoverability, and accountable owner.
This leads to a constrained decision rather than a synthetic “best” score: maximize urgent-case recall subject to a precision floor and a safe daily queue limit. In another system the constraint may be to minimize MAE while holding critical-location error below a ceiling, or to improve ranking while preserving exposure and safety requirements.
An overall gate is still too broad if errors concentrate. Publish the core measures for predeclared groups, intersections, environments, periods, and data-quality conditions identified by the use and harm analysis. Do not search dozens of slices after seeing the results until a favorable one appears. Small groups require counts and uncertainty; a confident point estimate cannot compensate for little evidence.
For the hospital release, the contract might require:
- urgent-case recall above a stated floor;
- review volume within staffed capacity and precision above its floor;
- no clinically important group below its recall floor;
- acceptable calibration within the risk bands shown to nurses;
- lower consequence-weighted loss than both current rules and a simple baseline;
- stable results across recent time-based backtests;
- a monitored threshold with a named owner, escalation trigger, and rollback rule.
The model with the highest AUC can lose this comparison. Its ranking may be strong while its usable threshold overloads the queue or concentrates missed cases in one group.
Write the Metric Contract
The release record should make the operating choice reconstructable. Record the decision, prediction unit, horizon, action, positive class or target, data window, prevalence, exclusions, sample counts, baseline, model version, primary measure, guardrails, severe-error counts, threshold procedure, segment floors, uncertainty method, calibration and capacity constraints, approver, monitoring trigger, and rollback action.
Then test whether the choice travels. For medical triage, identify the error that should dominate and the capacity that constrains it. For spam detection, decide whose loss a false positive represents and whether recovery is easy. For recommendations, decide whether finding one acceptable item, ordering the best item first, or exposing a useful range is the product goal. Finally, construct a rare-event example in which accuracy rises while recall falls, and show the four counts that make the apparent improvement possible.
If the chosen metric cannot explain those decisions, it is still a dashboard convention. The useful measure is the one that makes an error, its bearer, and the permitted trade-off visible.
Source Notes
- scikit-learn model evaluation, official documentation for classification, regression, ranking, threshold, and validation measures; verified 2026-07-19.
- scikit-learn probability calibration, official guidance on reliability diagrams, probabilistic interpretation, and calibration data separation; verified 2026-07-19.
- NIST AI RMF Core: Measure, voluntary guidance connecting measurement to deployment context, uncertainty, benchmarks, documentation, and risk decisions; verified 2026-07-19.
- See Evaluation Mindset: From Demo to Evidence for evaluation plans and release gates.