Production Data Systems Handbook / Chapter 51
Case Study: Metrics, Logs, Traces, and Time-Series Explosion
Control observability storage, query latency, retention, and alert quality by designing metrics, logs, traces, and time-series data as production data systems.
Preparing audio…
Audio edition
Case Study: Metrics, Logs, Traces, and Time-Series Explosion
The Dashboard Times Out First
At 09:07, checkout latency rises in one region. The page fires on error-budget burn, but the service dashboard does not load. A query grouped by tenant_id runs until it is killed. The metric store has begun rejecting new samples, so the blank panels might mean recovery, missing data, or an overloaded write path. Responders turn to logs and find a debug stream from the morning rollout. They open the trace view, but no one can say whether the absent requests were unsampled, dropped, or never received.
The platform has collected more evidence than ever and cannot answer the first incident question: is the slowdown tied to a release, a dependency, a region, or a class of tenants?
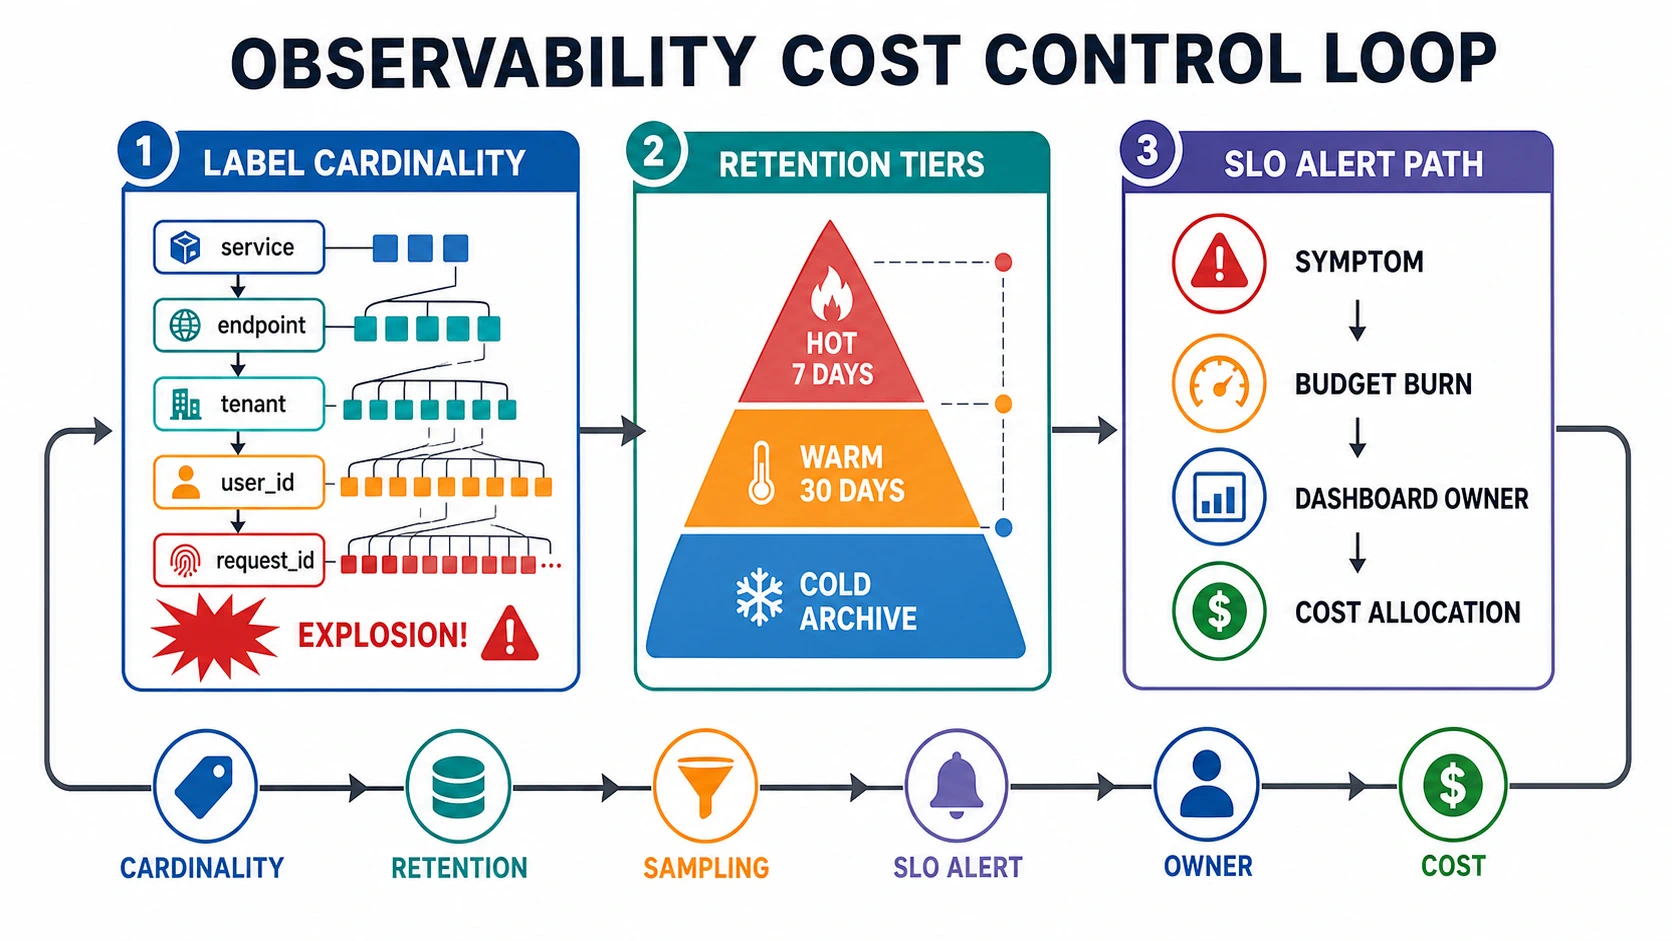
The failure began with a reasonable request. After an enterprise escalation, a team added tenant_id, user_id, and request_id to its latency histogram. That made individual requests addressable in a store designed for aggregates. At the same time, debug logs increased the indexing load and every trace acquired cache keys, feature flags, and experiment attributes. Incident queries then competed with ingestion for the same strained system.
Observability data is not exhaust. It has a data model, write path, indexes, retention policy, access controls, query workload, cost, and failure behavior. The incident can be repaired only by deciding which evidence belongs in metrics, logs, traces, and durable audit records—and what each signal may cost under pressure.
One Label Change Rewrites the Workload
The dangerous change looks small in code:
http_request_duration_seconds{
  service="checkout",
  endpoint="/api/orders",
  status_class="5xx",
  tenant_id="...",
  user_id="...",
  request_id="..."
}
The metric name is unchanged. Its storage contract is not. A time series is identified by the metric name and its label values, so every independent value can multiply the possible series. Ten services, forty normalized routes, five status classes, three regions, and four methods already describe as many as 24,000 combinations before histogram buckets. Adding 2,000 tenants raises the possible space to 48 million. A request identifier makes the bound follow request volume. Real traffic is sparse, but the store still pays for every series that appears: ingestion, index entries, memory, compaction, retention, and query planning.
This explains why service, normalized endpoint, status_class, and region can be useful metric labels while raw URLs, exception messages, cache keys, user_id, and request_id usually are not. Metrics answer repeated aggregate questions. Logs preserve event evidence. Traces reconstruct selected causal paths. A support index can provide bounded lookup by customer or request. An audit record preserves facts whose completeness and access rules cannot depend on sampling.
tenant_id sits on the boundary. A small set of contractual customer SLOs may justify an allowlisted tenant dimension with its own quota and short retention. Most investigations need tenant_tier in the metric and an exemplar that links an unusual bucket to a trace. The design follows the question, not a universal ban.
Code review alone cannot hold that boundary. The platform needs expected series counts, per-team quotas, allowlists for risky labels, reports of the fastest-growing label families, and a switch that can remove one damaging label without disabling all telemetry from the service.
Contain the Incident Without Going Blind
The first response is to stop growth while preserving the evidence that can explain user harm. The incident commander freezes new metric labels, broad indexed fields, and debug streams. The platform owner identifies recent instrumentation and collector changes, ranks writers by new series, log bytes, spans, and indexed fields, and confirms why samples are being rejected.
Load shedding then follows an explicit order. Repetitive success logs, verbose span attributes, stale dashboards, and speculative high-cardinality series go first. Error-budget evidence, errors, data-loss indicators, security audit records, and control-plane changes remain protected. If the platform cannot distinguish these classes at ingestion, its degradation policy is accidental.
Query traffic needs containment too. Default windows narrow, runaway group-bys stop, scheduled reports pause, and responders receive a known-fast incident view. Buying temporary capacity may be prudent, but capacity alone leaves the bad data shape in place.
The blank dashboard now becomes a fact to investigate rather than a fact to interpret. The view must expose collector backpressure, accepted and rejected samples by class, sampling decisions, and retention expiry. Absence is otherwise ambiguous: no event, no sample, a dropped write, a rejected series, or expired data all look alike.
Rebuild the Evidence Path Around Questions
Once the store stabilizes, the team returns to the question that prompted the bad labels: can support and on-call isolate an enterprise customer’s slow requests without damaging aggregate health monitoring?
The latency histogram keeps bounded dimensions: service, normalized route, status class, region, method, and perhaps tenant tier. Its buckets support the checkout SLO, release comparison, regional diagnosis, and capacity trends. Selected buckets carry exemplars pointing to trace identifiers.
The trace carries request causality across the API, queue, cache, database, and downstream provider. Consistent span names and bounded attributes make traces comparable. A sampling policy retains errors and unusually slow paths, increases coverage for a new release or an approved enterprise investigation, and takes a representative sample of ordinary successes. The interface states that traces are sampled and reports drops separately.
Structured logs carry event time, request and trace identifiers, deployment version, normalized route, error class, and the fields needed for a named support or incident workflow. Raw payloads, secrets, and personal data do not become searchable merely because they help one investigation. Field-level access and retention follow sensitivity. If support repeatedly needs customer lookup, a purpose-built index with ownership, authorization, and deletion behavior is safer than indexing every application log field.
The path between signals matters as much as their individual shape. A responder begins with SLO burn by region and route, opens an exemplar for one slow bucket, follows the trace to the saturated dependency, and uses the correlated log event for exact error context. No one asks the metric store to remember an individual request.
Retain Future Questions, Not Raw Volume
Recent telemetry supports incident response and deploy review. Older telemetry supports weekly reliability work, capacity trends, postmortems, audits, and occasional disputes. Those jobs do not need identical resolution.
The hot tier keeps high-resolution, bounded metrics and the logs and trace samples required for live diagnosis. The warm tier keeps downsampled SLO, traffic, saturation, release, endpoint, and regional trends with slower but predictable queries. The cold tier holds only evidence with a named long-range, audit, or compliance use, under a separate retrieval and access path.
Downsampling decides which questions remain answerable. Removing region too early destroys capacity and incident evidence; keeping every raw bucket forever charges future teams for detail they rarely use. The retention plan therefore names the questions preserved at each tier, the aggregation performed, the owner of deletion, and the retrieval delay.
Logs require classes rather than one default. Debug output may be valuable for hours. Application errors may be useful through the incident and postmortem window. Administrative actions and security audit records may require longer, controlled retention. These classes differ in completeness, sensitivity, access, and deletion—not only in duration.
Sampling makes the same kind of promise. Random trace sampling offers broad coverage but can miss rare failures. Rule- or tail-based sampling can retain slow paths, errors, risky workflows, and new releases. Success-log sampling can remove repetition while metrics still count the population. Every dashboard that shows sampled evidence must disclose the policy; every pipeline must count what it discarded.
Make the Fast Investigation Path the Cheap One
At 09:07, dozens of responders improvised broad searches because the platform had no reliable first path. Query governance should remove that need. Service health, error-budget burn, recent deploys, dependency saturation, queue lag, error exemplars, and trace samples become precomputed, owned views with safe time windows. Ad hoc queries receive scan and group-by budgets so one investigation cannot evict everyone else’s evidence.
This is not bureaucracy around debugging. It is workload design. Frequently used fields earn indexes; payload fields do not inherit them. Dashboards have owners and last-use dates. Incident query templates make the common, bounded questions easier than an all-history regex search. Expensive exceptions remain possible through an explicit path when the incident justifies them.
Alerting follows the same discipline. Checkout pages on user-visible error-budget burn, not on every internal threshold. Database latency, queue depth, cache behavior, and disk pressure remain diagnostic or predictive signals; they page only when a responder has a defined action. Each page names the user journey or invariant at risk, the first dashboard, a safe runbook action, and an owner able to change the system.
Put Cost Beside the Instrumentation Decision
A shared bill hides causality. Teams can add labels, indexed fields, retention, and dashboards while the platform team discovers the consequence weeks later. Cost allocation restores the missing feedback loop.
The platform reports volume and cost by service, owner, signal type, metric and label family, log class, retention tier, dashboard, and query class. It also shows which signals appeared in alerts, incidents, support investigations, or capacity reviews. A field no workflow has used is different from an expensive trace attribute that repeatedly shortens incidents.
The point is not chargeback theater. Owners need enough evidence to retire stale dashboards, shorten a debug stream, remove an unused field, or defend costly telemetry that protects a real promise. Cost belongs in signal design because ingestion and retention choices are production choices.
The Telemetry Contract and Recovery Drill
Before a risky telemetry change, the owner writes a one-page contract in ordinary language:
- What repeated operational question or required fact does the signal serve?
- Why is it a metric, log, trace, audit record, dashboard, or support index?
- What bounds its labels, indexed fields, attributes, volume, and query cost?
- Which hot, warm, or cold questions must survive, and for how long?
- What is complete, sampled, downsampled, delayed, or best-effort?
- What sensitive data is excluded or access-controlled?
- What is shed first under pressure, and how will responders see the loss?
- Who owns cost, stale artifacts, emergency rollback, and deletion?
The contract is lightweight for a bounded counter and stricter for a new metric family, high-volume label, indexed log field, longer retention period, broad trace attribute, debug stream, or expensive shared dashboard.
For the recovery drill, replay the 09:07 incident. Remove the bad label family without shutting off the service’s telemetry. Prove that series creation and rejection rates fall, SLO and error evidence remain available, and the incident dashboard answers region, release, dependency, and tenant-tier questions within its response target. Then follow one exemplar from the aggregate latency bucket through a sampled trace to a structured error log and an authorized support lookup.
Finish by recording what was lost during overload: rejected samples, unsampled traces, dropped log classes, expired data, and query gaps. Recovery is incomplete if the repaired dashboard quietly presents partial evidence as a complete history.
An observability platform is ready when it can answer production questions without becoming a second incident. Each signal has a bounded job; missing data has an explanation; retained detail has a future use; and the team that creates telemetry can see its operational and financial consequences. The next case study applies the same demand for ownership to analytical numbers, where plentiful data can produce several plausible answers and no trustworthy one.