Production Data Systems Handbook / Chapter 34
Observability for Data Systems
Design data-system observability around user experience, query behavior, saturation, lag, freshness, correctness, backup evidence, restore tests, and tenant impact.
Preparing audio…
Audio edition
Observability for Data Systems
The Green Dashboard and the Wrong Price
A merchant changes a product from 79 dollars to 59. The catalog API returns success in 80 milliseconds. Database CPU is quiet, the event broker is available, the indexer is consuming, and search latency is normal. Twenty minutes later, buyers still see 79 dollars.
Every component can be alive while the fact users depend on is wrong. This is the particular difficulty of observing data systems: the important condition often exists between components. The write committed but was never published, an event reached the wrong partition, a consumer acknowledged work it could not index, a partial update omitted the price field, or a cache kept serving an older document. A host dashboard cannot distinguish these failures because host health is not the promise.
Data-system observability connects a visible consequence to the path that produced it. Under pressure, it should let an operator answer four questions: who is affected, which facts may be wrong, where the path diverged, and what action is safe now. Signals that cannot help detect harm, localize it, or guide recovery may still help with capacity planning, but they do not make this path observable.
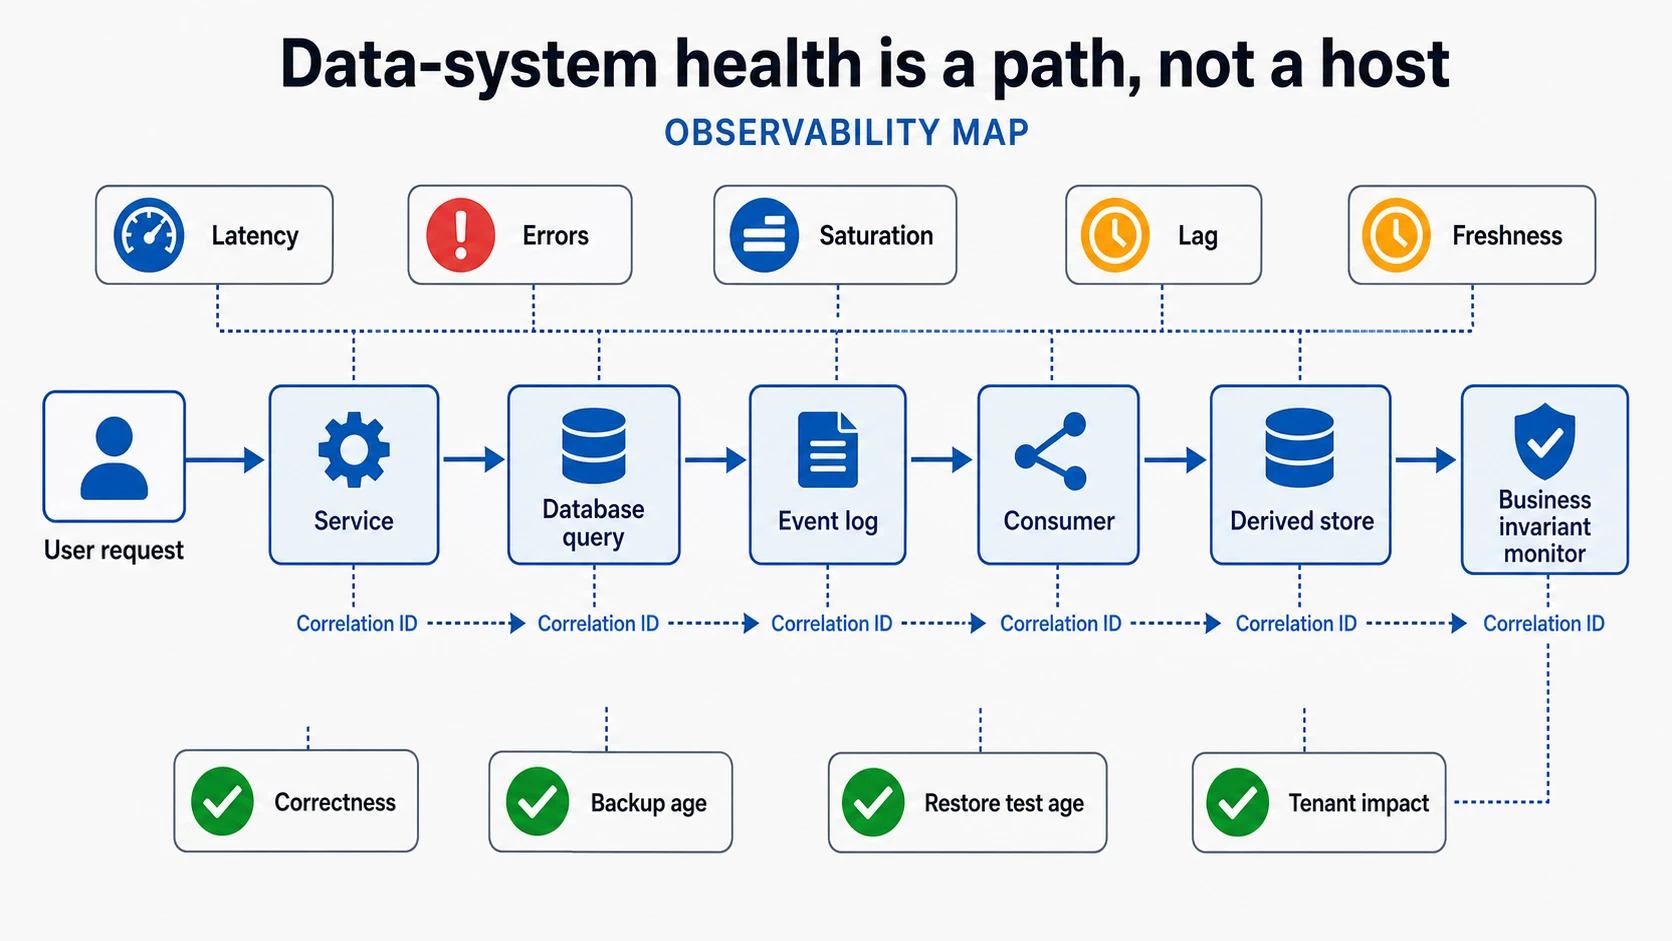
Follow One Fact Before Choosing Metrics
The price change gives the observability design a spine. The source of truth is the product row in the primary database. An outbox or change-data-capture process publishes the committed change. A consumer transforms it into a search document, the search engine makes that document visible, and a cache may stand between search and the buyer. The promise is not merely that each stage runs. It is that an accepted merchant update becomes visible to buyers within a stated interval without changing some other field.
Instrument the boundaries where that promise can be lost. Record the source commit time and schema version. Record when the change becomes publishable and when it enters the log. At the consumer, distinguish read, transform, rejection, retry, and acknowledgement. At the sink, record acceptance and visibility, which are not always the same event. Finally, compare a sample of recently changed documents with the source fields that affect buyers.
The resulting trace need not put a product ID into every metric label. Stable, bounded dimensions such as operation, region, merchant tier, event type, schema version, and result class belong in metrics. Product IDs, event IDs, and correlation IDs belong in sampled traces or searchable logs with deliberate retention and access controls. This preserves entity-level investigation without making the metrics system unusable or turning telemetry into an uncontrolled copy of sensitive data.
Now a complaint can become evidence. If no event exists for the committed change, inspect the source transaction and publication mechanism. If the event exists but has not been consumed, inspect partition lag, checkpoints, worker capacity, and poison records. If it was consumed but rejected, the reason and schema version identify the transformation or mapping boundary. If the indexed document is correct but buyers see the old price, move downstream to cache age, read routing, and query filters. The dashboard has not repaired anything; it has removed whole classes of guesses.
Six Conditions Hide Inside “Healthy”
The same trace exposes six different kinds of health. Keeping them separate prevents a single reassuring badge from concealing a different failure.
Serving: Can users complete the workflow? Measure request success, latency, timeouts, retries, and error classes by meaningful scope. A p99 spike has different weight when it blocks payment or entitlement than when it delays a low-stakes report. In the catalog path, both merchant updates and buyer searches can be fast while the end-to-end promise fails.
Correctness: Do protected facts and invariants still hold? Recent product documents should agree with the source on price, availability, and deletion state. Other systems need their own checks: ledger balances reconcile, one active subscription exists per account, tenant rows remain isolated, and orders do not ship before payment capture. These are production signals, not assertions reserved for test suites.
Progress: Is work moving through every stage? Consumer offsets, age of the oldest unprocessed event, event-time watermarks, checkpoint age, dead-letter depth, materialized-view age, and search visibility time each reveal a different boundary. Count lag alone is weak evidence: a quiet partition can contain one old, consequential event and still look small.
Capacity: Is the path approaching a condition that will stop progress or serving? Connection-pool wait, lock queues, worker queues, query concurrency, disk and I/O pressure, memory grants, compaction or cleanup backlog, hot partitions, checkpoint duration, and write amplification often deteriorate before errors appear. Their meaning comes from the workload around them, not a universal threshold.
Completeness and freshness: Are all expected facts present, and how current are they? A pipeline can process new events quickly while silently skipping a partition. A warehouse can be complete through yesterday and stale today. A cache can be fresh in age and wrong in content. Publish the boundary when decisions depend on it: “correct through 10:20” is honest in a way a green “job complete” badge is not.
Recovery: Can the team rebuild trustworthy state after failure? Backup completion proves that a backup process ran. Recovery evidence includes the last verified recovery point, restore test age and duration, schema compatibility, encryption-key availability, data-quality checks on the restored copy, replay or rebuild cost, and a named operator. Recovery belongs beside serving health because an untested backup is only a claim about durability.
Read Storage Signals in Their Workload
Once the stale-price trace identifies the database boundary, storage telemetry explains the physical work there. Query latency is useful when grouped by fingerprint, caller, and affected workflow. Endpoint latency alone cannot show that one query plan changed, a tenant’s data distribution shifted, or the application spent most of its time waiting for a connection.
Lock waits and deadlocks explain failed writes and tail latency that CPU charts miss. Preserve the blocking and blocked query shapes, wait duration, transaction age, application owner, and relation or key when available. Long idle transactions deserve visibility because they can hold locks, delay cleanup, and make unrelated work appear slow.
Connection counts need the same context. A database may have spare capacity while one service’s pool is exhausted, or thousands of idle connections may crowd out useful work. Track pool wait and checkout timeout alongside server sessions and idle-in-transaction state.
Replication lag matters only in relation to read routing and the promise of the reader. Five seconds may be irrelevant for an internal dashboard and unacceptable for an entitlement check immediately after payment. Cache hit rate is also a clue rather than a health score: analytical scans and latency-sensitive point lookups have different useful patterns. Pair cache, buffer, disk, temporary-file, and I/O signals with query fingerprints, rows read, workload mix, and tenant skew.
Growth gives saturation its direction. Free space, compaction, checkpoints, cleanup backlog, index builds, backups, restores, and backfills can all compete with serving. “Disk 90 percent full” announces a cliff; the growth rate and competing work show whether the system is walking toward it.
Chapter 35 will take the next step once a query fingerprint becomes the likely boundary: reproduce its workload, inspect the execution plan, compare estimated and actual rows, and test a fix. Observability should deliver enough context that this investigation begins with evidence rather than “add an index.”
Make the Pipeline Account for Every Stage
A single throughput graph cannot show whether the source published, the log accepted, the consumer transformed, the sink wrote, or the derived store exposed the result. Separate these stages even if one service currently performs several of them. A consumer can read quickly while every sink write fails; an acknowledgement rate can look healthy while a dead-letter queue holds precisely the events that matter.
Measure lag in both count and time. Track age of the oldest event, event-time watermark, processing delay, and end-to-end visibility as well as offsets. Checkpoint age is both a progress and recovery signal: after a stale checkpoint, restart may require a long replay or violate assumptions about state. Record checkpoint failure with the expected restart behavior and replay cost.
Dead-letter work needs identity and ownership, not merely depth. Preserve first and last failure time, reason class, schema version, source, impact, repair owner, replay eligibility, and repair state. Ten malformed test events and one rejected deletion request do not belong to the same severity simply because both increment a counter.
Derived stores also require drift checks. Reconcile search documents, warehouse aggregates, cache entries, materialized views, and replicas with source-of-truth expectations, especially after backfills, migrations, replays, index rebuilds, and partial outages. For the price incident, sample-based comparison can detect broad drift, while entity-level lineage lets support resolve the merchant who reported the first stale product.
Correctness Signals Must Produce Work
A global “bad rows” count locates no one and repairs nothing. A useful correctness finding names the invariant, entity type, scope, severity, first-seen time, sample keys, owner, and repair state. If reconciliation finds mismatches, it should create inspectable work that operators can assign, resolve, suppress with reason, and audit.
Control totals are valuable when individual comparison is too expensive. Compare event counts between source and sink, subscription state between billing and entitlement, inventory movements between ledger and availability views, deletion requests between the privacy service and derived stores, or money totals between operational and reporting systems. The comparison window and tolerated delay must be explicit; otherwise expected in-flight work becomes a permanent false alarm.
Duplicate detection has the same temporal problem. A duplicate may be acceptable until compaction, settlement, or reconciliation completes, or it may cause immediate double charging. Encode that distinction in the monitor. Freshness also inherits the consequence of its consumer: delayed executive reporting, fraud features, dispatch assignments, inventory reservations, and deletion propagation cannot share one severity merely because their lag is measured in seconds.
Show Impact Without Losing the Entity
Failures are rarely distributed evenly. Per-region, per-workflow, per-tier, and bounded tenant views can turn “search is stale” into “large merchants in region A have price updates older than 14:05.” Keep a global view beside them so filters do not hide the full incident.
Correlation identifiers earn their cost when they cross boundaries: service call, database write, event, transformation, derived write, repair job, and support tool. Perfect lineage for every low-value event may be too expensive, but high-value workflows need enough continuity to answer whether a particular order, payment, product, account, or deletion request reached each important stage.
Telemetry creates risks of its own. High-cardinality dimensions can overwhelm metrics. Verbose logs can expose personal or secret data. Sampling can miss rare correctness failures. Instrumentation can add latency and write pressure. Long retention increases privacy and cost burdens. Choose what to collect from the consequence and investigative need, then set access, sampling, and retention accordingly. “More data” is not an observability design.
An Alert Is a Request for Action
Page when user harm, invariant risk, unrecoverable lag, serving saturation, failed recovery evidence, or an unmanageable repair queue requires prompt action. Slower storage growth, low-severity drift, noisy logs, and approaching retention costs may belong in a ticket or scheduled review. Component prestige should not determine urgency; consequence should.
Every page should name the violated promise, affected scope, owner, first checks, runbook, escalation path, and stop condition. In the stale-price incident, that means knowing when to pause the indexer, replay from a safe offset, disable stale fields, invalidate a cache, or show merchants that search is behind. A lag threshold without those choices merely transfers interpretation to the person who was awakened.
Maintenance needs an explicit observability mode. Backfills, migrations, replays, index rebuilds, and restore drills change normal rates and lag. Annotate the operation and time-bound any adjusted thresholds, while leaving user-impact, invariant, and recovery-risk signals active. Silencing everything conceals damage; leaving every threshold unchanged makes expected work indistinguishable from failure.
The First-Five-Minutes Dashboard Brief
Do not force every signal onto one screen. Specify a small incident surface and the paths that open from it:
- State the user promise and show request success, latency, error class, retries, and impact by workflow.
- Show the source-to-derived path with end-to-end freshness, oldest work, watermark, checkpoint, rejection, and drift status at the relevant boundaries.
- Expose query fingerprints, pool and lock waits, deadlocks, rows scanned, plan-change clues, and the saturation resources that can impede this path.
- Put invariant checks, control totals, duplicate findings, deletion propagation, and reconciliation into owned repair queues with sample context.
- Show backup and restore-test age, last verified recovery point, restore duration, and whether recovery targets were met.
- Attach owners, runbooks, escalation paths, maintenance annotations, and stop conditions to the signals that can page.
For the catalog path, the opening view should answer whether updates are being accepted, how old the oldest buyer-visible change is, how many merchants and products are affected, which stage first diverged, and who owns the next action. A separate detail view can carry product-level lineage and repair records. That division preserves a fast incident overview without flattening the evidence needed to resolve one customer case.
Observability Drill
Choose a production data path that currently has ordinary host and service monitoring. Draw the path of one consequential fact from user action to every derived view. Mark the source of truth, publication boundary, log or queue, consumers, caches, indexes, warehouses, repair jobs, and recovery mechanism.
Write the promise and its acceptable delay. Add one user-impact signal, one storage or query signal, one saturation signal, one progress or freshness signal, one correctness check, and one piece of recovery evidence. Then take a concrete entity and ask whether an operator could follow it across the path without putting its identifier into a high-cardinality metric. Give every actionable failure an owner and a safe first response.
The map is finished when it can turn “the system is green, but the price is wrong” into a bounded investigation. That is the handoff to the rest of this part: the invisible work is now visible enough to examine.