Production Data Systems Handbook / Chapter 36
Locks, Contention, Hot Keys, and Tail Latency
Diagnose tail-latency spikes by finding the shared resource, queue, wait type, hot key, saturation point, and verification signal behind the symptom.
Preparing audio…
Audio edition
Locks, Contention, Hot Keys, and Tail Latency
When the Median Is a Bad Alibi
A production incident can hide behind a healthy median. During a product launch, checkout still completes in 80 ms for most requests, but one percent now takes six seconds. CPU is moderate. The execution plan from the previous chapter shows a short indexed inventory update, not a scan or spill. Yet timeouts cluster around one item.
The query is fast once it runs. The missing time lies in front of it. Every purchase must update the same inventory row, and some transactions keep that row locked while calling a fraud service. Arrivals briefly outpace commits; timed-out clients retry; the line lengthens. Unrelated checkouts keep the median respectable while buyers of the hot item inherit the queue.
Tail latency is often contention made visible. The resource may instead be a table, metadata lock, index range, shard, partition, connection, worker, disk, memory grant, replica apply path, or compaction pipeline. The implementation changes; the investigative movement does not. Find where requests wait, identify the work ahead of them, connect the queue to its triggering workload, and choose a signal that will prove the line grew shorter.
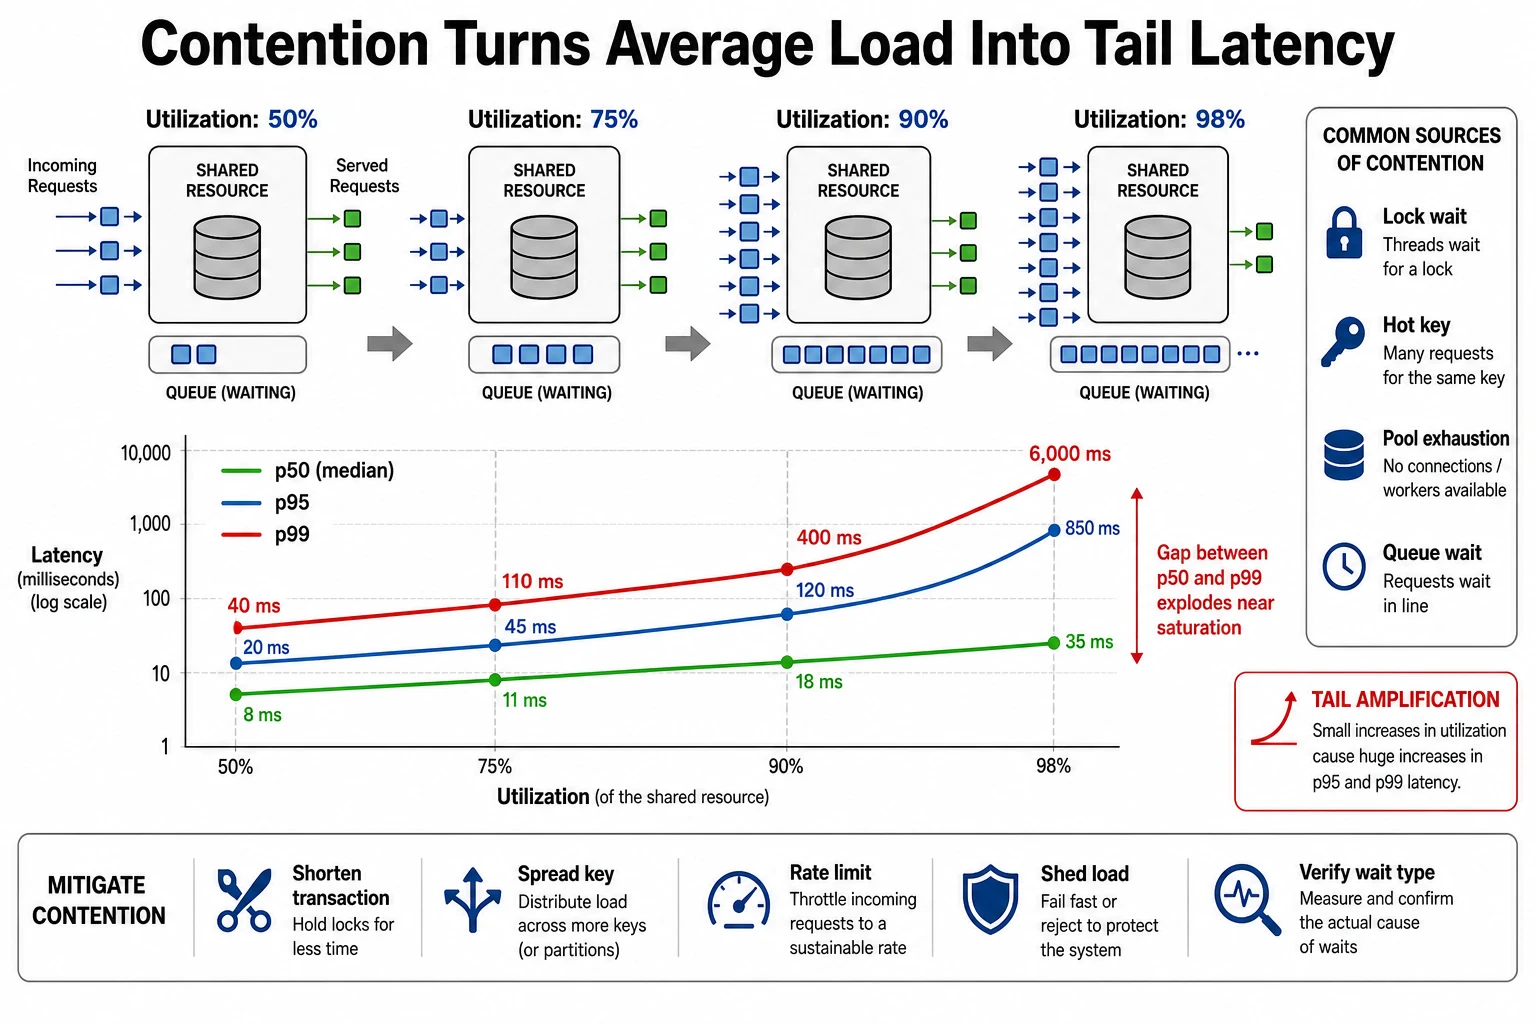
The Queueing Model to Keep in Your Head
Every contention investigation needs four nouns: resource, holder, waiter, and queue. In the checkout incident, the resource is the inventory row. The holder is the transaction paused on fraud. Each later purchase is a waiter. Their order and accumulated delay form the queue.
The same nouns travel. The resource is whatever has limited concurrent capacity. The holder is the transaction, process, request, worker, or background job currently using it. A waiter cannot proceed until capacity is released. Its latency therefore includes work performed by operations that arrived before it.
This vocabulary matters because it prevents vague incident language. “The database is slow” is too broad to act on. “Checkout updates are waiting on row locks held by inventory reservations for the same SKU” points to evidence and fixes. “Consumers are lagging” is broad. “The partition for tenant 417 has one worker, 40 times the normal message rate, and a growing queue while other partitions are idle” is a contention diagnosis.
Average utilization is a weak safety signal. At low utilization, arrivals often find the resource free. Near saturation, more arrivals find it busy, queue behind earlier work, and inherit accumulated wait. A few long holders can create a large tail even when most work is short. A system can be at 45 percent average CPU and still have one saturated partition, one blocked table, or one exhausted pool.
The first investigation question is therefore not “what is the average load?” It is “which shared resource turns ordinary operations into waiters?”
Separate Execution Time From Wait Time
Before changing schemas, adding indexes, or scaling hardware, split latency into execution time and wait time. Execution time is the work itself: scanning rows, joining inputs, sorting, aggregating, writing pages, serializing responses. Wait time is time spent unable to proceed: waiting for a lock, connection, worker, memory grant, disk, replica replay, checkpoint, compaction, or network slot.
A slow operation can be innocent of expensive work. A query with a reasonable plan may spend most of its wall-clock time waiting for a lock. An API handler may wait 900 ms for a database connection before running a 20 ms query. A consumer may process messages quickly once scheduled while a hot key queues thousands of messages ahead of it. If the team only measures total duration, it will tune the wrong component.
Useful instrumentation names the wait class and the caller. At the service layer, measure connection acquisition time, handler execution time, downstream calls, queue wait, retry count, and timeout reason. At the database layer, capture lock waits, blocked and blocking sessions, transaction age, active query text or fingerprint, rows touched, I/O wait, temp spill, memory wait, and maintenance activity. At the partitioned or streaming layer, capture lag, queue depth, per-key throughput, worker occupancy, and retry volume.
Do not require perfect observability before acting. During an incident, a short record of affected endpoints, slow windows, active transactions, sampled lock and pool waits, and hot tenants can distinguish “make each operation cheaper” from “reduce the queue in front of the shared resource.”
Lock Queues Start With Transaction Shape
Database locks are not defects. They are one of the ways a database protects correctness while concurrent operations run. The production problem appears when the lock scope is broader than the workload can tolerate, or when the lock is held longer than the queue can absorb.
Row locks are usually manageable when transactions are short and keys are distributed. They become visible when many requests update the same row or nearby key range: inventory for a popular item, a balance for a high-volume account, a tenant summary row, a global counter, a job lease, or an allocation record. The query may be indexed and cheap, but every caller still needs the same lock.
Table locks and metadata locks tend to be less frequent and more surprising. A schema change, index build, partition operation, migration script, maintenance command, or foreign-key validation can take a lock stronger than the application team expected. The result is often a sudden wall of latency across unrelated code paths because they all need the same table or catalog state.
Deadlocks are a different signal. A deadlock is a cycle: transaction A waits for B while B waits for A. Retrying the failed transaction can be correct, but blind retry loops under high contention can multiply traffic and deepen the queue. Read deadlock reports as workload evidence. Which tables, indexes, predicates, and lock acquisition order created the cycle? Is every code path acquiring locks in the same order? Is a batch job touching rows in a different sequence from the online path?
Idle-in-transaction sessions deserve immediate suspicion. They hold locks while doing no useful database work. The cause may be an application transaction opened before validation, an external API call made before commit, a request handler that streams a response while the transaction remains open, an ORM pattern that begins early and commits late, or a manual console session forgotten during investigation. The fix is often not a new index. It is a shorter critical section.
Hot Keys Collapse Distributed Capacity
Hot keys concentrate load that the system design assumed would be spread. The hot key may be a tenant, account, product, search term, campaign, queue key, region, merchant, room, project, or time bucket. Global dashboards average it away. Users assigned to that key feel the tail.
Sequential keys create hot append points when every new write lands near the same index page, shard range, or partition. Time buckets create the same shape when every event for the current minute, hour, or day goes to the same partition. Popular items are a special case: one sale, incident, game, marketing campaign, or customer can turn a balanced fleet into a single saturated lane.
The fix is not automatically “shard more.” Spreading writes changes the read path, repair path, and sometimes the correctness model. A sharded counter reduces write contention but requires aggregation and reconciliation. Adding a random suffix to a key can break efficient range scans. Splitting the current-day partition into buckets may help ingest but complicate retention and query pruning. Moving a heavy tenant to dedicated capacity improves fairness but adds placement and operations work.
Good evidence is per-key, not only per-cluster. Look for top keys by request count and write count, per-partition p95 and p99, per-tenant queue depth, lock wait grouped by relation and predicate pattern, consumer lag by partition, and logs that carry tenant or entity identifiers. A system that cannot answer “which keys were hot during the spike?” is under-instrumented for this class of incident.
Pools Are Queues With Better Branding
Connection pools are queues in front of the database. When all connections are busy, new requests wait before the database sees them. The symptom can look like random application latency because slow time is hidden in pool acquisition, not query execution.
Too few connections can throttle a service below what the database can handle. Too many can overwhelm the database with concurrent work it cannot execute efficiently. A large pool per service instance may increase context switching, memory pressure, lock competition, deadlock probability, and tail latency. The right pool size is tied to measured throughput, service time, transaction duration, and the database’s actual bottleneck, not to a default copied across services.
Worker pools follow the same rule. A stream processor with one worker per partition can be idle overall while one hot partition falls behind. A batch platform can exhaust execution slots. A search system can saturate merge workers. A job queue can fill every worker with slow tasks while quick tasks wait behind them. The queue is the fact; the layer is implementation detail.
Pool telemetry should separate acquire time, active count, idle count, waiting count, timeout count, execution time, transaction duration, and caller. Without that split, teams often respond by adding capacity to the database when the immediate queue is in the application pool, or by increasing the pool when the database is already saturated.
Background Work Is Still Traffic
Data systems do work that users did not directly ask for: compaction, vacuum, checkpoints, rebalancing, backups, index builds, statistics collection, materialized-view refreshes, retention deletes, replica catch-up, repair, and backfills. This work preserves performance, durability, space usage, and correctness. It also consumes resources that foreground requests need.
The incident pattern is common. The workload is ordinary until a backup saturates I/O, compaction falls behind, a checkpoint stalls writes, a vacuum or cleanup process touches hot pages, an index build competes with reads, a rebalance moves busy partitions, or replica catch-up delays fresh reads. There is no application deploy to blame. The missing fact is that production traffic includes maintenance traffic.
Background work should appear on the same timeline as user symptoms. If p99 grows at 02:00, the incident view should show backup bandwidth, checkpoint duration, compaction backlog, cleanup start time, index build phase, partition movement, and bulk job progress. A maintenance task without an owner, throttle, pause rule, or impact dashboard is production traffic without admission control.
The response is usually a control problem: schedule, throttle, isolate, prioritize, pause, or make the task incremental. Disabling maintenance can be valid during containment, but it is rarely a complete fix. It may lower latency today while building storage bloat, replica lag, recovery risk, or a larger maintenance cliff.
Close the Queue Without Breaking Inventory
Return to the launch. The first proposal is to add read replicas because “the database is under load.” Replicas cannot release the primary row lock, and they do not change the transaction that holds it.
The affected requests all update the same inventory row. Transactions reserve stock, write an order, call a fraud service, and then commit. During normal traffic, the lock is held briefly enough that nobody notices. During the launch, many requests want the same SKU. A few fraud calls take hundreds of milliseconds. Every transaction behind them waits for the row lock. Retries after client timeouts add more contenders. The median remains fine for unrelated items, while the hot item forms a lock queue.
The operational mitigation is to shorten the critical section and control arrivals. Move the fraud call outside the inventory-locking transaction where the business invariant allows it, acquire the inventory lock as late as possible, commit quickly, bound retries with jitter, and apply per-item admission control so timeouts do not become retry storms. If the invariant requires reserving before fraud, record that explicitly rather than smuggling an unsafe optimization into the incident.
The design mitigation may be different. The team could move from a single inventory counter to reservation records plus asynchronous reconciliation, pre-allocate stock into buckets, serialize purchases for a flash-sale item through a purpose-built queue, or isolate launch inventory from ordinary catalog inventory. Each option changes correctness, user experience, recovery, and operations. The evidence does not say “use this pattern.” It says the shared row is the bottleneck and any durable fix must remove, shorten, or govern that shared critical section.
Verification is concrete: lock wait time for the inventory relation drops, transaction age shortens, pool wait drops if it was secondary, p99 improves for the hot SKU, retry volume falls, and correctness checks show no oversell or lost reservation.
Fix Patterns and Their Trade-Offs
Shorten critical sections when locks are the bottleneck. Move network calls and expensive computation outside transactions when invariants allow. Acquire locks late, update only the necessary rows, commit early, and keep retry loops bounded. Shorter hold time reduces wait for every caller behind the lock.
Spread keys when the workload is concentrated and the access pattern can tolerate distribution. Use better partition keys, bucketed counters, write spreading, tenant-aware placement, or dedicated isolation for heavy tenants. Prove that reads, rebuilds, deletes, reconciliation, and repair still work after spreading the write path.
Shape demand when arrival rate exceeds sustainable service rate. Rate limits, per-tenant fairness, backpressure, admission control, and load shedding protect the system from serving every request slowly. A fast rejection or explicit queue can be kinder to users and easier to recover from than a long timeout followed by a retry.
Batch carefully. Batching can reduce overhead, lock churn, and write amplification. Oversized batches hold locks longer, consume memory, increase rollback cost, and create larger tails. Choose batch size from measured service time and recovery cost, not from convenience.
Isolate maintenance and bulk work when it competes with foreground traffic. Use throttles, work windows, resource groups, lower priority, incremental jobs, separate replicas, or dedicated clusters where the workload justifies it. Isolation is not free; it adds cost and operational surface. It is justified when shared capacity repeatedly creates user-visible tails.
Partition or precompute when the shared resource is structurally wrong for the workload. These are design changes, not incident toggles. They alter ownership, correctness, migration, recovery, observability, and cost. Treat them with the same seriousness as any data model change.
Add capacity only after naming the queue it will shorten. More CPU helps if CPU service time is the bottleneck. More connections may hurt if locks or I/O are saturated. More shards help if the key can be distributed and the read path can absorb the change. Capacity without a contention hypothesis is an expensive way to postpone understanding.
The Investigation Record
Before accepting the checkout fix, the team writes down the claim it is making:
From 14:02 to 14:11, checkout p99 for SKU 8841 rose from 180 ms to 5.4 s while other items remained below 240 ms. Purchase transactions waited for the row lock on that SKU. The holders spent most of their transaction age in the fraud call; client retries increased the number of waiters. We will move fraud outside the locked section where the reservation invariant permits, cap and jitter retries, and limit concurrent attempts for this SKU. We will compare row-lock wait, transaction age, waiter count, hot-SKU p99, retry volume, and successful reservations before and after the change. An inventory reconciliation must show neither oversell nor lost reservations.
That paragraph is the decision artifact: symptom, resource, wait type, holder, trigger, mitigation, tail evidence, and correctness evidence in one causal account. For a pool, hot partition, backup, or compaction queue, keep the fields and replace the facts. If a field cannot be filled, the diagnosis is not yet strong enough to justify a structural fix.
Practical Exercises
-
Diagnose checkout contention. A popular item has p99 checkout latency above five seconds during a launch. Write the evidence you would collect to distinguish slow SQL from row-lock contention. Include the lock holder, waiters, retry behavior, transaction duration, and one correctness check that proves the fix did not oversell inventory.
-
Redesign a hot time bucket. An event table partitions by day, and all writes for the current day hit one partition while historical reads need efficient date ranges. Propose a revised key or partitioning scheme. State what improves, what read path becomes harder, how retention works, and which metric proves the hot partition cooled down.
-
Audit a connection pool. Choose one service and record pool size, active connections, idle connections, waiting callers, acquisition latency, query execution time, transaction duration, timeout rate, and database saturation during a busy window. Decide whether the pool is too small, too large, or hiding a deeper queue.
Field Reference: Contention Debugging
When a latency spike looks random, build one timeline with request rate, p50, p95, p99, pool acquisition time, lock wait, queue depth, hot keys, transaction age, retry volume, slow query fingerprints, background tasks, deploys, and tenant distribution. Then write one sentence in this form:
Requests for [workflow/key] wait on [resource] held by [holder] when [trigger] happens; the fix reduces the queue by [mechanism], and we will verify it with [wait signal, tail signal, correctness signal].
Reject any diagnosis that stops at “the database is slow,” “add capacity,” or “cache it” without naming the queue. Tail latency becomes debuggable when the team can point to the shared resource, the waiters behind it, the work that holds it, and the signal that proves the queue is shorter. The correctness evidence belongs beside the latency evidence: a fast inventory path that oversells is the next chapter’s kind of failure.