Production Data Systems Handbook / Chapter 19
Time-Series Systems and Observability Stores
Design time-series and observability storage around cardinality, retention, downsampling, query windows, alert semantics, and operating cost.
Preparing audio…
Audio edition
Time-Series Systems and Observability Stores
The Label Added During the Incident
At 10:03, checkout latency rises after a deploy. The service already emits a latency histogram labeled by route, method, status class, region, and environment. An engineer wants one more dimension—request_id—so the slow requests can be found from the dashboard.
The change seems harmless. It adds no new measurement and the telemetry store continues accepting writes. Yet each request identifier creates a label combination that will probably never appear again. Ingestion climbs, recent-window queries slow down, and alert evaluation begins to lag while the incident is still active. The signal intended to explain checkout has damaged the system used to observe it.
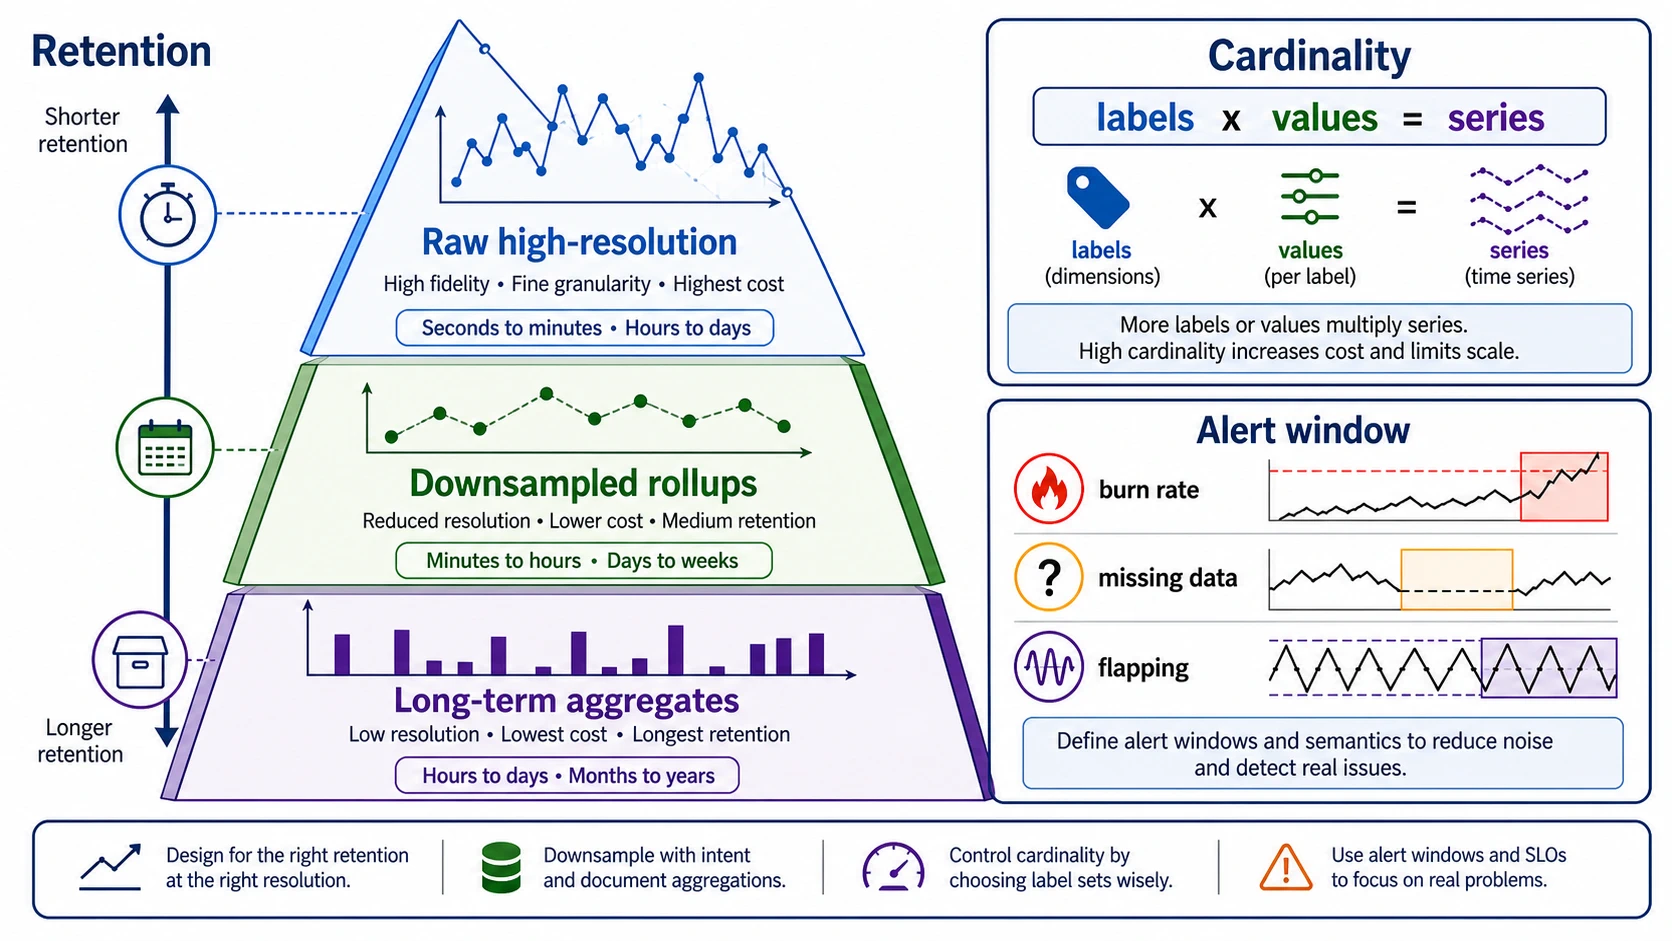
That failure reveals the design problem. A time-series store is built for append-heavy measurements read through windows and aggregations: the error rate over five minutes, the latency distribution since the deploy, the queue depth before saturation, the pace at which an error budget is being consumed. Its useful unit is not an individual request but a series: one metric identity and one distinct set of label values receiving samples over time.
Time ordering gives the store efficient compression, partitioning, compaction, and windowed scans. Labels make the measurements sliceable. Retention keeps recent detail and older summaries. The same three properties also create its limits. Too many label combinations multiply series, too much retained resolution multiplies samples, and unbounded queries compete with alerts during the moment they matter most.
The design task is to decide what operational memory deserves to exist: at what resolution, under which dimensions, for how long, and for which response.
Trace One Measurement Into a Series
Suppose the platform records API duration as http_request_duration_seconds. For one observation it has six bounded dimensions:
- 12 services;
- 40 route templates;
- 3 methods;
- 5 status classes;
- 3 regions;
- 2 environments.
If every value occurred with every other value, those dimensions could create 43,200 label combinations. Reality is usually sparser, so this product is an upper-bound estimate rather than a forecast. It is still useful: it makes the order of magnitude discussable before a rollout. A classic bucketed histogram may create several stored series for each combination, so bucket design belongs in the estimate too.
Now add 50,000 tenants. Even if only a fraction of the theoretical combinations appear, growth follows traffic and customer behavior rather than a boundary the platform controls. Add raw URLs, pod names, user IDs, or request IDs and the metric becomes a sparse event index disguised as an aggregate.
High-cardinality dimensions are tempting precisely because they answer sharp debugging questions. The mistake is not wanting the answer; it is asking the metric store to preserve every request so that it can answer it. Keep dimensions that describe bounded populations responders routinely aggregate: route template rather than raw URL, status class when exact codes do not change the response, region or availability zone when failures can be isolated there. Put an individual request identifier where individual requests belong.
The bound must be real, not accidental. A tenant label may be reasonable for a product with sixty contracted tenants and unsafe for a consumer platform. A pod label looks bounded until autoscaling and rolling deploys turn names over continuously. For each label, record expected values, a credible peak, what causes new values, and who can stop growth. If the team cannot estimate the order of magnitude, the signal is not ready for shared production.
Cardinality is also a shared-capacity decision. One team’s instrumentation consumes index memory, storage, network, and query capacity used by every other team. The platform therefore needs per-owner series budgets, reports of new and high-growth label sets, rejection visibility, and a rollback path that works faster than a purchasing process.
Send Each Question to the Right Signal
Removing request_id from the latency metric does not abandon the incident question. It sends the question to a signal shaped for it.
Metrics preserve numerical behavior across populations. Request counts, error ratios, latency histograms, saturation, queue depth, replica lag, and cache hit ratio are useful because responders aggregate them across time and a bounded set of dimensions. Stable names and units matter; a time series whose meaning changes silently cannot support a durable alert or comparison.
Logs preserve discrete events and their local context. A structured request log can carry the request identifier, error code, selected fields, and a reference to the trace. Rich indexing and long retention are expensive, so fields should still earn their collection and index cost.
Traces connect work across service boundaries. A trace is the natural place to follow the slow checkout through authentication, inventory, payment, retries, and database calls. Sampling and attribute discipline remain necessary: moving an unbounded field out of metrics does not make collection free.
Profiles locate resource consumption in code. They can connect a period of high CPU, allocation, blocking, or lock contention to the functions responsible. Deploy and configuration events give the time axis context, allowing a responder to see that the latency distribution shifted when version 2026.07.18-4 reached one region.
The useful question is not “which observability product holds everything?” It is “what is the least durable signal that can answer this operational question?” The checkout dashboard shows population behavior in metrics, links an exemplar or trace when available, uses logs for a particular failed request, and reaches a profile when the path points to resource consumption. Correlation joins the signals; duplication does not.
Retention Changes What the Evidence Can Say
During the checkout incident, raw high-resolution samples help distinguish a sixty-second spike from a sustained shift and show what happened around the deploy. A week later, five-minute rollups may be enough to review the SLO. A quarter later, daily aggregates may support capacity planning. These are different instruments, not cheaper copies of the same one.
Downsampling must preserve meaning. An average can erase a short but severe latency spike. A maximum preserves the peak but says nothing about how many users experienced it. Precomputed percentiles generally cannot be averaged or combined into a correct percentile for a larger population or window. Histogram counts can be aggregated when their boundaries and semantics remain compatible. Counter rollups must account for resets; gauge rollups must say whether they preserve a last value, an extremum, or time-weighted behavior.
For the checkout service, the team might retain high-resolution latency histograms through the period in which incident responders need exact windows, keep compatible rollups for SLO review, and keep coarser distributions for capacity trends. The policy should state when each transition occurs and which questions become impossible afterward. A year-long dashboard backed by daily aggregates must not imply that minute-level evidence still exists.
Telemetry classes need separate clocks. Debug logs, security audit records, billing evidence, traces, profiles, and operational metrics carry different investigative, legal, privacy, and deletion obligations. One global retention setting either destroys valuable evidence early or keeps sensitive, expensive detail without purpose.
Archive is useful only with a tested retrieval path. Data that takes three days and an improvised restore to query does not support a two-hour incident-review deadline. Conversely, keeping every raw sample in the hot query tier because retrieval has never been designed is an operating failure disguised as convenience.
An Alert Gives a Window a Consequence
The checkout latency graph can tolerate exploratory ambiguity. A page cannot. An alert is a recurring query authorized to interrupt a person or trigger automation, so its definition must include the user harm it represents, the evaluation window, the behavior of missing data, the responder, and an action that could change the outcome.
Window length is policy. A short window catches a sharp outage quickly but can page on noise and flap around a threshold. A long window sees sustained harm but may detect a severe outage too slowly and remain active long after recovery. When an SLO is the governing promise, burn rate expresses how quickly current failures would consume its error budget. Long and short windows together can detect meaningful consumption while confirming that the burn is still active. They are a starting structure, not numbers to copy without regard for traffic and user consequence.
Low-traffic services resist rate-based certainty. One failed request can imply an enormous burn rate while offering little evidence of a systematic failure. The response may require synthetic checks, grouping related traffic, longer windows, or a product decision about whether every failed request truly deserves an immediate page.
Missing telemetry needs its own semantics. No samples may mean no checkout traffic, a dead service, failed scraping, broken instrumentation, an overloaded collector, or a network partition. Treating absence as zero silently turns a blind observability system into a healthy service. The alert contract should say whether absence is healthy, unhealthy, unknown, or a separate telemetry failure.
When the alert fires, its linked view should preserve the evaluation window and show scope, user-facing effect, related dependencies, telemetry health, and recent changes. If responders must open twenty panels and rediscover the alert’s reasoning, the dashboard is decoration rather than part of the response.
Protect the Answers During the Incident
The observability store is a production dependency. The checkout incident can increase both sides of its load at once: failing instances emit more logs and traces while responders refresh dashboards, widen time ranges, and run unfamiliar queries. Capacity sized only for a quiet-day ingestion average is capacity sized for the wrong event.
Intake controls need explicit overload behavior. A bad deploy, target-discovery mistake, fleet restart, or replay can create an ingestion spike. Quotas, rate limits, buffers, and drop policies should identify the owner and dataset affected. Rejected samples must be visible somewhere that does not depend entirely on the failing path.
Query controls should protect alert evaluation and responder views from broad wildcard searches, high-cardinality groupings, auto-refreshing dashboard walls, and exploratory scans. Bounded default windows, query limits, recording or rollup rules for repeated work, cost attribution, and workload isolation preserve the few questions that must remain fast.
Backfills and repairs need a separate lane. Replaying old samples must not appear as current behavior, wake responders, or starve live ingestion. A repair should carry an explicit time range, owner, throttle, provenance, and a way to rebuild affected rollups without silently mixing old and new semantics.
The store also holds unusually concentrated operational evidence. Logs and traces may contain payload fragments, account identifiers, IP addresses, internal URLs, tokens, or regulated data. Redaction should happen as early as practical; access, audit, expiration, and deletion must extend through hot storage, archives, exports, and derived indexes.
Finally, observe the observability system. Track active and newly created series, label-value growth, bytes and samples by owner, rejected telemetry, collector lag, compaction or rollup delay, expensive queries, dashboard cost, and alert-evaluation latency. A storage bill is a late signal. Series growth and query delay reveal the design failure while there is still time to reverse it.
Write the Signal Contract
Before the revised checkout instrumentation ships, write one record for the signal and the response it supports:
Operational question and user consequence:
Signal name, type, unit, and owner:

Labels or indexed fields:
Expected and peak values per dimension:
Estimated series or index growth:
Growth limit and rollback trigger:

Histogram boundaries or aggregation semantics:
Raw resolution and retention:
Rollups, compatibility rules, and retention:
Archive, retrieval deadline, and deletion path:

Dashboard question and default window:
Alert condition, long and short windows:
Missing-data behavior:
Responder, linked evidence, and first action:

Sensitive fields and redaction point:
Ingestion quota and rejection signal:
Query isolation and replay procedure:
Cost and telemetry-health indicators:
Fill it first for http_request_duration_seconds. Keep service, route template, method, status class, region, and environment only if each changes an aggregation or response. Estimate the label combinations and include the histogram representation. Move request and user identifiers to sampled traces or access-controlled logs, then state how a responder crosses from the metric to those records.
Now rehearse the failure that motivated the design. Deploy a new unbounded label in a controlled environment. Verify that growth is attributed, the budget or limit becomes visible, alert evaluation remains isolated, and the owner can disable the label without discarding the measurements needed for the incident. Then simulate a telemetry gap and confirm that the checkout alert distinguishes missing evidence from healthy traffic.
The review is complete when adding request_id no longer looks like free diagnostic power. The team can name the series it will create, the questions it will answer, the evidence that belongs elsewhere, the detail time will erase, and the queries that must survive the next incident. That is the value of a time-series system: not unlimited memory, but operational memory with boundaries strong enough to remain useful under pressure.