Production Data Systems Handbook / Chapter 35
Query Performance and Execution Plans
Debug slow queries through workload evidence, execution plans, row estimates, indexes, locks, I/O, memory, concurrency, tested fixes, and regression guards.
Preparing audio…
Audio edition
Query Performance and Execution Plans
A Slow Query Is a Claim About Work
A query fingerprint has emerged from the observability work in the previous chapter. The orders page is slow, especially for the largest merchants. That is enough to open an investigation, but not enough to choose a fix.
Under pressure, the familiar answers arrive early: add an index, add a cache, increase the instance size, rewrite the endpoint, move the report off the primary database. Any of them can be right. Each can also hide the cause, tax every write, serve stale data, destabilize another plan, or turn one visible problem into several quieter ones.
First turn the complaint into a claim about physical work. Which query shape is slow? For which caller, tenant, parameter set, time range, and concurrency level? Did latency change because the plan changed, the data distribution changed, a statistic went stale, an index stopped matching the predicate, a sort spilled to disk, a join multiplied rows, a lock queue formed, or background work competed for the same I/O path?
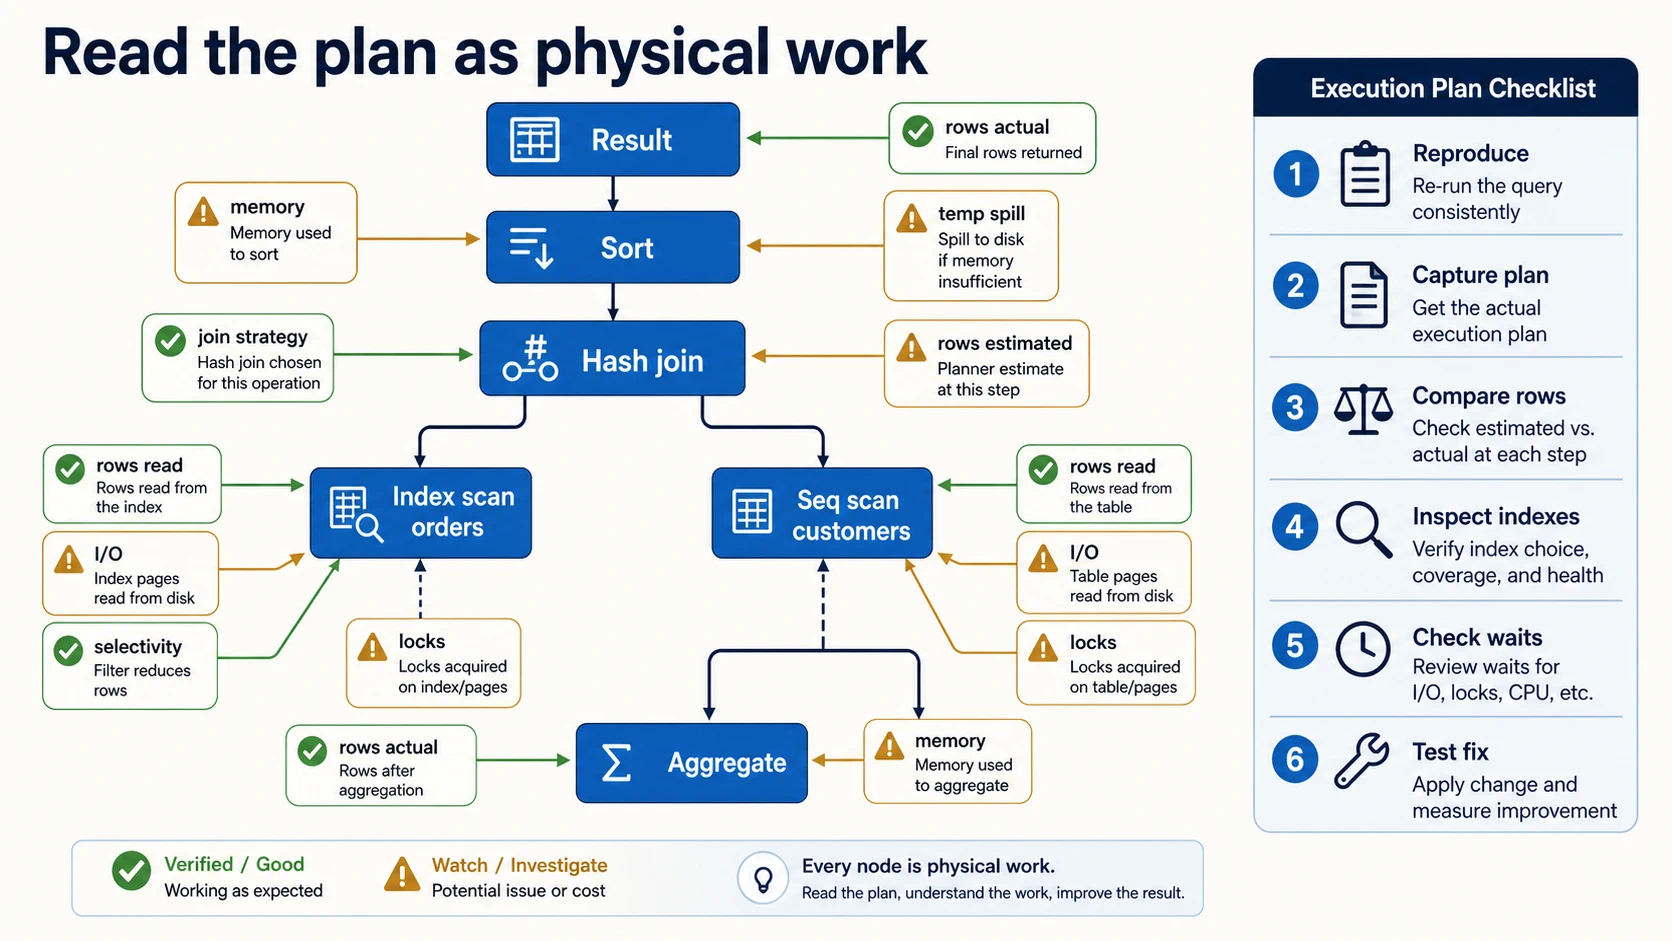
An execution plan is the database’s explanation of how it intends to do the work. It names access paths, scans, joins, sorts, aggregations, materialization points, row estimates, memory expectations, and sometimes actual timings. The plan is not the whole truth. It can omit application wait time, connection-pool delay, network cost, cache behavior, or concurrency effects. But without the plan, query tuning becomes folklore: engineers stare at SQL text and argue from taste.
The discipline is sequential: reproduce the symptom, capture the plan, compare estimated and actual rows, inspect indexes and statistics, check waits and concurrency, test candidate fixes against production-shaped data, and leave a guard against recurrence.
Reproduce the Same Shape of Pain
Begin with the observability evidence already collected: query fingerprint, caller, endpoint, latency percentile, error rate, affected tenants, recent deploys, data growth, background jobs, and saturation signals. A plan for a harmless local sample is not evidence for a production incident. A query that is fast for a tenant with 2,000 orders and slow for a tenant with 40 million orders must be reproduced with the larger tenant’s shape: row counts, selectivity, time range, parameter values, concurrent readers and writers, and relevant indexes.
Capture the query text or logical query shape after the application has bound parameters. ORMs can generate surprisingly different SQL for similar code paths. Feature flags can add predicates. Authorization filters can join tenant or role tables. Pagination and sort options can change the access path. The useful unit is the query fingerprint plus the parameters that make it expensive.
Also capture where time is spent. Application latency can include connection-pool wait, query execution, row transfer, object hydration, serialization, network retries, or downstream calls. Database execution time can include CPU, I/O, lock wait, memory grant wait, temp spill, replica replay, or scheduler wait. If the symptom is “the page is slow” but the query takes 40 ms and the connection pool waits for 900 ms, the execution plan is not the main crime scene.
A good reproduction names the boundary of the claim: “This query shape, for large tenants, over a 180-day range, when sorted by created_at desc, regressed from p95 180 ms to 2.8 s after the July 2 backfill.” That sentence gives the plan something to explain.
Read the Plan as a Work Order
Execution-plan vocabulary varies across database engines, but the physical questions are stable.
Scans explain how rows enter the plan. A sequential scan is not automatically wrong. It can be right when most rows are needed, when the table is small, or when an index would force many random lookups. It is suspicious when a highly selective lookup over a large table reads everything because a predicate, function, type cast, collation, or leading-index-column mismatch prevents an index access path.
Index access is useful only when it reduces total work. Ask which predicates match the index prefix, whether the predicate is selective, whether the index order satisfies the sort, whether included or covering columns avoid extra table lookups, and whether the index creates unacceptable write, storage, cache, or maintenance cost. An index that makes one dashboard faster can slow every write on the table.
Joins explain how row sets meet. A nested loop can be excellent when the outer side is small and the inner lookup is indexed. It can explode when the outer side was estimated at 200 rows and actually produces 2 million. A hash join can handle larger inputs by building an in-memory structure for one side and probing with the other, but it becomes expensive when memory is insufficient or the build side is badly chosen. A merge join benefits from sorted inputs, but sorting can dominate if order is not already available.
Sorts and aggregations explain where the engine must organize rows. Sorting for ORDER BY, merge joins, distinct operations, grouping, or window functions can be cheap in memory and painful when it spills to temporary storage. Aggregation cost depends less on the final result size than on rows entering the aggregation and number of groups created. A report that returns 50 rows may still scan, join, and group hundreds of millions of records before producing them.
Materialization and temporary structures are clues about repeated work, memory pressure, and plan barriers. Some materialization is deliberate and beneficial. Some appears because the query shape prevents predicate pushdown or requires a large intermediate result. Treat it as a place to ask, “Why does this intermediate object exist, how large is it, and can earlier filtering make it smaller?”
The most important plan-reading habit is to compare estimates with actuals. If a node estimated 500 rows and returned 5 million, the rest of the plan may be a rational answer to a false premise. Bad estimates cause bad join order, wrong join algorithms, undersized memory grants, unexpected spills, and scans that looked cheap only on paper.
The Orders Page That Aged Badly
Consider a marketplace admin page that lists recent orders for a merchant. For years, the query has been ordinary:
select o.id, o.created_at, o.status, o.total_cents, c.email
from orders o
join customers c on c.id = o.customer_id
where o.merchant_id = ?
  and o.status in ('paid', 'refunded')
  and o.created_at >= ?
order by o.created_at desc
limit 50 offset ?;
The small merchants are fine. Large merchants report that page 1 is sometimes slow and page 400 is unusable. A first guess says “add an index on merchant_id.” The evidence says that is incomplete.
The plan for a small merchant uses an index on (merchant_id, created_at) and returns quickly. The plan for a large merchant walks a wide range, filters many statuses, joins customers row by row, sorts because the chosen access path does not preserve the final order after filtering, and then discards a large offset. The estimate says the date range should return 8,000 rows. The actual row count is 1.7 million because one merchant’s growth and a recent status backfill changed the distribution. The underestimated outer side makes the row-by-row join far more expensive than the optimizer expected. The sort spills. The deep page spends most of its time skipping rows the user will never see.
Now the fixes can be compared instead of guessed. A composite index on (merchant_id, status, created_at desc, id) may help the filtered, ordered access path, but it adds write cost to a high-volume table and may not handle all status combinations. Rewriting to keyset pagination with (created_at, id) removes the large-offset walk, but product behavior changes: users can move forward and backward by cursor rather than jumping cheaply to an arbitrary page number. Precomputing merchant order summaries may help dashboards but not ad hoc filters. Moving historical order exploration to an analytical store may be right if the admin page has become a reporting interface rather than an operational lookup.
The plan did not dictate a single answer. It made the trade-off visible: access path, row count, sort cost, pagination behavior, write overhead, and product semantics.
Statistics Are Part of the System
Optimizers choose plans from statistics, constraints, and cost models. When those inputs are wrong, the selected plan can be wrong even when the SQL text is unchanged.
Cardinality is the central estimate: how many rows will each predicate, join, and grouping step produce? Histograms help with skewed values. Distinct-count estimates help with grouping and joins. Correlation matters when columns are not independent. country and city, tenant_id and object_count, status and created_at, or merchant_id and order_volume can make independent estimates wildly optimistic.
Stale statistics make yesterday’s data shape guide today’s workload. Bulk loads, deletes, backfills, partition swaps, tenant migrations, retention jobs, and product launches can change table size and value distribution quickly. The failure often appears after growth rather than after a code deploy: the query “suddenly” became slow because the plan crossed a threshold.
Parameter sensitivity is another common trap. The same query shape can be cheap for a small tenant and expensive for a large tenant, cheap for a rare status and expensive for a common one, cheap for a narrow time window and expensive for a year. Some engines cache or reuse plans in ways that favor the first or most common parameter set. Others replan more often but still depend on statistics that may blur tenant-specific skew.
Treat estimates as hypotheses, not verdicts. When estimated and actual rows diverge sharply, investigate statistics freshness, histograms, constraints, column correlation, tenant skew, implicit casts, functions around indexed columns, and predicates that hide selectivity from the optimizer. Adding hardware before understanding the false premise may buy time, but it leaves the plan fragile.
Indexes Are Contracts With the Write Path
An index is a stored promise that a certain access path matters enough to maintain. That promise has a cost. Every insert, update, delete, backfill, replication stream, backup, restore, and cache working set may now carry the extra structure.
A strong index proposal states the access pattern it serves: equality predicates, range predicates, order, join key, covering columns, uniqueness, and expected selectivity. It also states what the index does not serve. Composite indexes are ordered structures; changing column order changes which predicates and sorts can benefit. A prefix that starts with a low-selectivity column may be less useful than it looks. An index built for where tenant_id = ? and created_at > ? order by created_at is a different tool from one built for where created_at > ? and tenant_id = ? order by status.
Partial or filtered indexes can be powerful when the workload repeatedly touches a small, stable subset, such as active subscriptions, unprocessed jobs, non-deleted records, or recent events. They are dangerous when product behavior changes and the “small” subset becomes most of the table. Covering indexes can avoid table lookups, but they widen the index and increase maintenance cost.
Index removal deserves the same discipline as index creation. Experimental indexes should have an owner, expected query fingerprints, before-and-after measurements, write-cost observations, and a review date. Unused indexes are not harmless; they consume storage, memory, write throughput, maintenance time, and operator attention.
Rewrites, Precomputation, and Moving Work
Query rewrites are appropriate when the SQL shape prevents the database from doing less work. Push selective filters before joins when semantics allow. Avoid wrapping indexed columns in functions or casts that block the access path. Remove unnecessary columns from hot paths. Split unrelated work when one query is serving two different user needs. Preselect candidate rows before joining to large tables. Replace large offsets with cursor predicates when the product can accept cursor navigation.
Precomputation is appropriate when many reads repeatedly ask for the same expensive fact and the system can tolerate explicit freshness rules. A materialized view, rollup table, search document, stream-maintained summary, or cached aggregate moves cost from read time to write time, batch time, or stream processing. The new questions are correctness questions: how fresh must it be, how is it rebuilt, how are backfills handled, how are deletes propagated, and what monitor detects drift?
Partitioning helps when queries can prune work, isolate tenants, separate lifecycle operations, or reduce maintenance blast radius. It does not automatically make a bad query good. A query that touches every partition may become more complex without becoming faster. Partitioning is a design and operations decision, not a magic performance flag.
Denormalization helps when joins are structurally too expensive for the workload and the duplicated facts can be governed. It introduces repair, backfill, freshness, and ownership obligations. Caching helps when repeated reads tolerate staleness and invalidation can be made reliable enough. It can also preserve the appearance of speed while the underlying query remains expensive and correctness becomes harder to reason about.
Moving the workload is sometimes the honest answer. Analytical scans, full-text ranking, vector similarity, graph traversal, large time-series rollups, and exploratory reports may not belong on the primary transactional path. The evidence should show that the workload class has changed, not merely that the current query is inconvenient.
Waits Keep the Plan Honest
Execution plans describe chosen work. Waits describe what the work was stuck behind. A query can have a reasonable plan and still be slow because it waited for a row lock, table lock, connection, worker, memory grant, disk, replica replay, checkpoint, compaction, backup, or noisy neighbor workload. The slow-query workflow only needs one contention rule here: do not call a query inefficient until you know whether it was mostly executing or mostly waiting.
Capture wait evidence alongside the plan. Was time spent reading pages, spilling temporary files, waiting on locks, acquiring a connection, replaying replica changes, or waiting for memory? Did the slow window overlap a backfill, index build, vacuum, compaction cycle, checkpoint, backup, schema change, deploy, or tenant traffic spike? Did all parameter sets slow down, or only the ones that touched a hot key or large tenant?
This distinction prevents wrong fixes. An index may reduce lock hold time by making an update find rows faster. It will not help much if the real issue is a transaction left open while the application calls an external service. More memory may reduce a sort spill. It will not fix a plan that reads the wrong 200 million rows. A cache may reduce read pressure. It will not repair stale statistics that will surprise the next uncached path.
Pagination Is a Query Design Choice
Pagination is often treated as a UI detail, but it determines database work. Offset pagination asks the database to produce an ordered result, skip some number of rows, and return the next page. Page 1 may be cheap while page 10,000 is expensive because the engine still has to walk, count, sort, or discard earlier rows.
Cursor pagination uses a stable position, usually an ordered key such as (created_at, id), so the next query can continue from the last seen value. It works best when the ordering is deterministic, the index supports the filter and order together, and product behavior accepts cursor navigation. Mutable sort fields can create missing or repeated records unless the product explicitly tolerates that behavior. A deterministic tie breaker is not optional.
Exact count queries are another hidden tax. Showing “1,842,331 results” for every filter may require a large scan or aggregation. The product may be just as well served by “more than 10,000,” an approximate count, a delayed count, or no count on hot paths. Query performance work often includes renegotiating product promises that accidentally require expensive physical work.
Write the Slow-Query Report Before Choosing the Fix
A useful report is short enough to write during an incident and exact enough to survive it. For the orders page, its opening sentence can carry the fingerprint and impact together:
The merchant-orders query, called by the admin page with paid and refunded statuses over a 180-day window, regressed from p95 180 ms to 2.8 s for high-volume merchants after the July 2 backfill; small merchants remain unaffected.
Attach the captured plan and mark the first consequential disagreement between estimate and reality: 8,000 rows expected, 1.7 million produced. Record the resulting nested-loop work, spilled sort, index access path, and offset rows discarded. Put wait evidence beside execution evidence. In this case the query spends its time reading, joining, spilling, and skipping rather than waiting on a lock or connection; that negative finding is part of the diagnosis.
Then describe the data shape that makes the plan fail: merchant skew, status distribution, table growth, the backfill, current indexes, and the parameter sets that remain fast. Compare at least two fixes against that same shape. The composite index must earn its write and maintenance cost. Cursor pagination must earn its change to navigation semantics. A precomputed or analytical path must state freshness, rebuild, and ownership obligations.
Close the report with measured results under production-shaped data and concurrency, the costs observed outside the target query, rollback criteria, and the signal that will expose recurrence. A report that says only “add the index” records an action. It does not preserve the reasoning needed to operate the system later.
Regression Guards for Query Performance
A performance fix is incomplete until the team can detect its failure mode returning. The guard should match the risk.
For plan instability, track query fingerprints, latency percentiles, rows scanned versus rows returned, plan hash or plan-change indicators where the engine exposes them, temp spill, and index usage. Alert carefully; plan changes are not always bad. The goal is to surface unexpected changes on important queries before users rediscover them.
For statistics risk, schedule and monitor statistics maintenance appropriate to the engine and workload. Add checks after bulk loads, backfills, tenant migrations, partition maintenance, and large deletes. If a system has known skew, record it in the runbook so future engineers do not assume uniform distribution.
For index changes, keep before-and-after measurements and rollback criteria. Measure write latency, storage growth, replication lag, maintenance duration, and backup or restore impact, not only the target query. A new index that saves one endpoint and slows the ingest path may still be the wrong trade-off.
For query rewrites and pagination changes, add tests that preserve semantics as well as speed. Cursor pagination should prove deterministic ordering, no missing records across page boundaries under acceptable update conditions, and correct behavior for ties. Precomputed or denormalized results need freshness, rebuild, drift, and deletion-propagation checks.
The guard does not need to freeze a plan forever. Production data changes. The guard should make change visible, explainable, and reviewable.
Performance Drill
Pick one slow query from logs or a realistic sample. Capture the fingerprint, caller, parameters, affected users, current indexes, plan, estimated rows, actual rows, waits, and recent workload changes. Write a one-page report with two candidate fixes. One should be a local fix such as an index or rewrite. One should be a design fix such as cursor pagination, precomputation, partitioning, denormalization, caching, or moving the workload.
Reject any answer that says only “add an index” or “cache it” without proving why the physical work gets smaller, which new cost appears, and how regression will be detected. The payoff is a faster query whose improvement the team can explain and defend.
Sometimes the plan is reasonable and the elapsed time is still terrible. That is not a failed investigation. It is the handoff to the next question: what shared resource made this query wait?