The Rust Engineering Handbook / Chapter 87
Profiling CPU, Memory, I/O, Locks, and Async Tasks
Choose profiling evidence from the suspected resource, distinguish work from waiting, and validate production performance repairs without changing the question.
Which profiler should you run first?
The question is premature. A relay can miss its latency objective while CPUs are saturated, while every CPU is mostly idle, or while one worker is saturated and the rest are parked. Those states require different evidence. A CPU flame graph cannot tell you why a request waited in a queue before it was polled. A heap snapshot cannot reveal a burst of allocations that were freed before the snapshot. An async span that covers an entire request can make waiting look like execution. The profiler must follow the suspected resource and time interval.
An investigation earns trust when it translates the symptom into a resource hypothesis, selects evidence that can falsify it, preserves the workload and executable, and validates the repair against the original user-visible measure. Profiles explain where resource time or space went. They do not replace the benchmark design from Chapter 84, the cost model from Chapter 85, or the artifact record from Chapter 86.
Ask whether the system is working, waiting, or retaining
Start with three verbs.
- Working consumes CPU instructions, performs allocations, copies bytes, hashes keys, formats output, or executes kernel work.
- Waiting is runnable but unscheduled, blocked on a lock or syscall, asleep for a timer, waiting for queue capacity, or pending until an async wake.
- Retaining keeps memory, file descriptors, buffers, tasks, or queued work reachable longer than intended.
One request can move through all three. A parser works, a bounded sender waits, a queued payload retains its buffer, and a worker later works again. “The endpoint is slow” loses those distinctions.
Write a falsifiable first hypothesis: “p95 rose because classifier CPU service time increased, causing queue age to grow,” not “Rust got slow.” Then identify corroborating and contradicting evidence. Higher on-CPU samples in the classifier plus growing queue age support the hypothesis. Flat classifier samples with long scheduled delay contradict it. Rising resident memory with flat live heap suggests allocator behavior, mapped files, stacks, or another non-heap source rather than a retained object graph.
The fixture makes this discipline explicit:
pub fn first_evidence(suspect: Suspect) -> &'static str {
    match suspect {
        Suspect::Cpu => "sample stacks with symbols",
        Suspect::Allocation => "record allocation count and bytes by stack",
        Suspect::HeapGrowth => "compare live-heap snapshots after quiescence",
        Suspect::Syscall => "trace syscall type, duration, and result",
        Suspect::LockContention => "measure wait time separately from hold time",
        Suspect::Queueing => "record queue depth and oldest-item age",
        Suspect::AsyncStall => "compare task poll time with scheduled delay",
    }
}
That mapping chooses a first discriminating signal, not a complete tool plan.
Match evidence to the suspected bottleneck
Read the selection tree from symptom to resource state, then follow the lower timeline: CPU evidence matters causally only when its change precedes the queueing symptom it is supposed to explain.
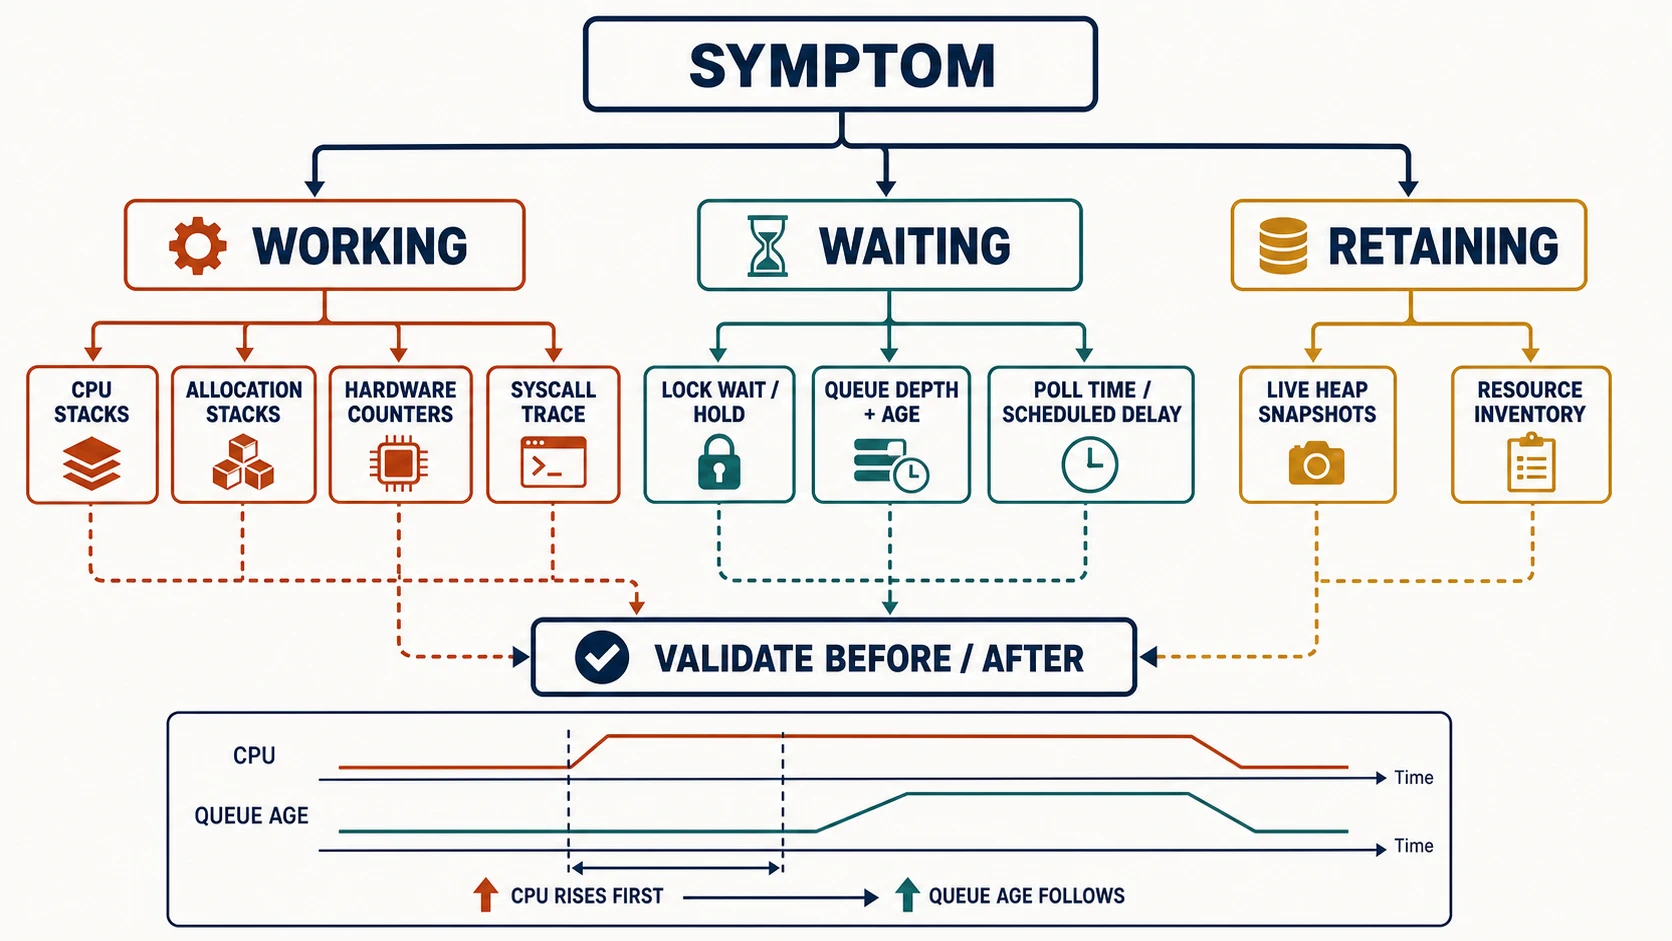
CPU: sample before instrumenting every call
Statistical sampling interrupts execution periodically and records stacks. Aggregated stacks answer where sampled on-CPU time accumulated with relatively low and controllable overhead. A flame graph renders folded stacks: width represents sample frequency, not elapsed duration for one invocation and not intrinsic importance. A wide frame can be a frequently called cheap function, a genuinely expensive body, or an artifact of missing inlining/symbol information.
Sampling is a strong first move for an unknown CPU regression because it observes the whole process without requiring predicted call sites. Instrumentation is stronger when you need exact counts, phase boundaries, arguments, or per-request duration. It also changes the program: timers, field formatting, atomic counters, buffering, and exporter work can distort short operations. Instrument only the boundary needed to test the hypothesis, measure its overhead, and leave the expensive detail disabled or sampled in normal operation.
Preserve the sampled artifact identity. Record executable hash, build profile, target, debug-information policy, deployment image, host architecture, sampling frequency, duration, thread/process selection, and load phase. Without symbols, stacks collapse into addresses or unresolved frames. Without matching build IDs or symbol files, post hoc symbolization can confidently describe the wrong binary. Optimized Rust adds inlining and monomorphized frames; a profile remains evidence about that build, not a stable source-level call graph.
Allocation rate is not live-heap growth
An allocation profiler attributes allocation count and bytes to call stacks. It finds churn: formatting a field per event, rebuilding buffers, or cloning payloads. A live-heap snapshot asks what remains allocated at an instant. Repeated snapshots after comparable quiescent points expose retention growth. The two questions are deliberately different.
A service can allocate gigabytes per minute yet maintain a flat live heap because objects die promptly. Another can allocate slowly but leak one task and its buffer per failed connection. Track at least allocation rate, retained bytes, object/stack attribution, and time since the workload phase began. Resident set size is operationally important but includes more than live Rust heap objects; allocator arenas, stacks, code, mapped files, and pages not returned to the OS can separate RSS from a heap census.
Snapshot only at meaningful phases. Comparing a warmed steady-state snapshot with one taken during a burst confounds workload with retention. To investigate heap growth, stop admission if safe, let queues drain, trigger the same application cleanup, and compare what remains reachable. If the system cannot quiesce, use time-series allocation/lifetime evidence and label that limitation.
Hardware counters test cache and branch stories
Cycle, instruction, cache-miss, and branch-miss counters can challenge a source-level cost story. Ratios such as instructions per request and misses per thousand instructions are often more comparable than raw totals. Counter availability, names, multiplexing, skid, privilege, virtualization, CPU model, frequency scaling, and kernel policy are platform facts. Record them.
Do not infer “the cache is the bottleneck” from a large miss count alone. Compare a controlled baseline, normalize by useful work, and connect the counter change to latency or throughput. A repair that reduces branch misses while adding enough instructions to slow the request is not a performance win.
Syscall traces locate kernel boundaries
Syscall tracing answers whether the process repeatedly crosses into the kernel, blocks in reads or writes, retries after partial progress, calls fsync, contends on futexes, or polls too aggressively. Capture syscall type, duration, result, byte count, and thread when the tool supports them. Counts without durations can overemphasize frequent fast calls; durations without return values can hide repeated errors.
Tracing itself has overhead and may expose paths, addresses, payload fragments, or tenant behavior. Begin in a controlled environment. In production, narrow the process, syscall family, time window, and captured arguments. Prefer aggregate counters when they can answer the question. Never attach an unrestricted tracer merely because the incident is urgent.
Separate lock wait, lock hold, and protected work
“Mutex time” is ambiguous. A contender waits before acquisition. The owner holds the lock while executing a critical section. A long hold may be legitimate protected work, blocking I/O accidentally performed inside the guard, preemption of the owner, or instrumentation overhead. Measure wait and hold separately, then attribute both to call sites.
A profile showing futex waits tells you contention exists but not which invariant requires the shared state. Inspect the critical section and the access pattern. Credible repairs include shrinking the protected state, moving I/O outside the guard, sharding by independent key, passing ownership to one task, or replacing frequent mutation with snapshots. Each changes consistency, memory, ordering, fairness, and failure behavior. Replacing a Mutex with an RwLock can compile and regress a write-heavy workload or create starvation; replacing it with atomics can erase a compound invariant.
Measure under representative concurrency. A lock-free microbenchmark with one thread proves almost nothing about a saturated relay. Conversely, synthetic maximum contention can obscure the production distribution of keys and operations.
Put queues on the same timeline as CPU
Queue depth is an amount; queue age is a delay. A depth of 100 may be healthy at 100,000 events per second and disastrous at ten. Record admission rate, completion rate, capacity, current depth, oldest-item age, rejection/block duration, and downstream service time. Align those signals with CPU utilization and sampled stacks.
Imagine this sequence:
time        t0        t1        t2        t3        t4
CPU         35%       96%       99%       98%       42%
classifier  normal    wide sampled frame  wide      normal
queue depth 12        170       498/cap   498       41
oldest age  2 ms      19 ms     84 ms     211 ms    17 ms
admission   steady    steady    rejected  limited   steady
CPU saturation precedes capacity and age growth. That ordering supports a service-time regression. If CPU remained at 35% while oldest age rose, investigate blocked workers, scheduling, downstream I/O, or lost wakes instead.
The lab’s regressed mode deliberately performs redundant classification work in its single worker while preserving the baseline result checksum and accepted count. Run baseline and regression on the same host and optimized artifact. The exact microseconds are observations, not portable thresholds. The teaching conclusion comes from the controlled difference plus preserved behavior, not from one impressive ratio.
Async tasks require poll-aware evidence
An async task alternates between being polled and pending. A long wall-clock span can contain little CPU. Distinguish:
- poll duration: how long one call to
Future::pollran before returning; - scheduled delay: time from a wake or readiness notification until the executor next polls the task;
- idle/pending duration: time legitimately waiting for I/O, a timer, channel data, or another resource;
- task lifetime: total time from spawn to completion or cancellation.
Long polls suggest blocking code, excessive CPU work without yielding, or a large synchronous destructor. Long scheduled delays suggest executor saturation, unfair work, too few workers, or a worker blocked outside the runtime’s blocking boundary. Many pending tasks can be normal; growth without completion may signal lost cancellation, retained resources, or an unavailable dependency.
Tokio’s tracing ecosystem can expose task poll and scheduled-duration distributions when the runtime and subscriber are configured for it. Tokio’s official console guidance describes a real-time task/resource view, and current console-subscriber documentation defines scheduled duration as the interval from wake until the next poll. Treat these as tool semantics tied to recorded versions. They are not Rust language guarantees.
For application spans, instrument the future rather than holding a synchronous span-enter guard across .await. Current tracing documentation warns that such a guard may produce incorrect traces because execution can resume on another thread or interleave with other tasks. Attach context to the future so it is entered for polls. Also route blocking or CPU-heavy work through a designed blocking pool or separate service, with concurrency limits; moving unlimited work to spawn_blocking merely relocates overload.
Profile production without becoming the incident
Production profiling is a risk decision. Before attaching anything, specify maximum duration, sample frequency, scope, expected CPU/memory/output overhead, data classification, storage location, stop condition, and operator. Test the procedure against the same binary in staging. Confirm kernel permissions and container namespaces before the incident.
Prefer bounded capture. Sample one replica, rotate traffic if safe, cap buffers, and monitor profiler drops. Redact or disable arguments that can contain secrets. Keep symbol artifacts access-controlled: symbols improve diagnosis but can expose internal names and source paths. If a profiler requires elevated privileges, treat it as privileged production access, audit its use, and remove the access after capture.
Observer effect belongs in the record. Compare service metrics immediately before, during, and after capture. If throughput changes when profiling begins, the profile describes a perturbed system; it may still be useful, but the limitation must follow the artifact.
Validate the repair against the original decision
A narrower flame is explanatory evidence, not the acceptance criterion. Repeat the original experiment with the same workload model, optimized artifact, environment controls, warmup, and distribution reporting. Verify correctness and overload behavior too. A classifier repair that improves median latency but drops events or increases p99 queue age has changed the contract.
Use a before/after record:
| Item | Before | Candidate | Decision |
|---|---|---|---|
| artifact hash and symbols | recorded | recorded | comparable? |
| workload and arrival shape | recorded | same or explained | comparable? |
| p50/p95/p99 latency | distribution | distribution | user effect? |
| throughput and rejects | counts | counts | contract preserved? |
| suspected resource evidence | profile/counter | repeated | mechanism changed? |
| CPU, queue age, memory | aligned series | aligned series | cost moved elsewhere? |
| profiler overhead/drops | measured | measured | evidence trustworthy? |
Then remove diagnostic instrumentation that no longer earns its cost, or convert only the durable low-cardinality signals into the operating contract.
Investigation exercise: repair the relay regression
Run profiling-observability-lab in baseline and regressed modes with the same release artifact. Preserve command, compiler, host, output, and executable hash. Form three competing hypotheses: classifier CPU, allocator churn, and queue synchronization. Choose the first evidence for each before using a profiler.
Profile or instrument only enough to distinguish them. Add queue age beside depth. Repair the injected classifier loop without changing accepted counts or telemetry context. Repeat both the resource evidence and the user-visible comparison. Your report passes when another engineer can explain why the selected tool answered the hypothesis, identify the observer effect and symbolization limits, reproduce the comparison, and show that cost did not merely move into waiting, allocation, or dropped work.
Review questions
- Is the symptom translated into working, waiting, retaining, or a measured combination?
- Can the first evidence falsify the stated hypothesis?
- Are allocation rate and live retention kept separate?
- Are lock wait and hold time separate, with the protected invariant still visible?
- Do queue signals include age, capacity, and admission/completion rates?
- Does async evidence distinguish poll duration from scheduled delay and pending time?
- Are binary identity, symbols, host, tool version, and profiler overhead recorded?
- Does validation repeat the original workload and correctness/overload contract?
The next operating question is no longer where one captured build spent its resources. It is whether routine telemetry can reconstruct what happened before an operator decides to profile. That is the boundary of observability.
Sources and version notes
- Tokio: Getting started with tracing documents structured events and spans in Tokio applications.
tracingcrate documentation distinguishes spans from events and warns against holding a span-enter guard across.await.tracing::Instrumentdocuments attaching a span to a future so it is entered when polled.- Tokio console next steps describes task/resource diagnostics. Tool fields, overhead, and availability are version-sensitive.
- Linux
perfdocumentation is a platform-specific starting point for sampling and hardware counter tooling; commands and permissions vary by kernel and environment.
The lab was written for Rust 2024 with MSRV 1.85. Profiles, counters, allocator views, kernel tracing, and async-console output remain tool-, platform-, build-, and version-specific evidence.