The Rust Engineering Handbook / Chapter 88
Observability: Structured Events, Metrics, Errors, and Backtraces
Design bounded telemetry that reconstructs request, overload, error, panic, and shutdown behavior across Rust task and process boundaries.
At 02:14, five signals disagree.
The latency alert says ingestion is slow. A warning says a batch timed out, but not which request produced it. The request counter is flat because the exporter is retrying. One replica reports ready while its queue is full. A panic line contains a thread name and source location, yet the task that admitted the work ran on a different thread. None of these records is false. Together, they still cannot reconstruct the incident.
Observability is not the volume of output. It is the ability to answer a bounded set of operating questions from signals whose identity, context, cost, privacy, and failure behavior were designed in advance. For relay-service, the minimum contract must explain admission, queueing, processing, overload, failure, panic, and shutdown without logging payloads or turning every request identifier into a metric series.
Design from the operator’s question backward: use the cheapest signal that preserves the necessary dimensions, carry causal context across boundaries, bound cardinality and exporter work, and expose telemetry degradation without turning it into application failure.
Reconstruct causality before adding detail
An operator investigating one failed request needs different evidence from a capacity planner comparing a week of traffic.
| Question | Primary signal | Necessary dimensions | Dangerous substitute |
|---|---|---|---|
| Are requests failing now? | counter/rate | service, operation, bounded outcome | one log per success |
| How slow is the population? | latency histogram | operation, outcome, deployment | average latency only |
| What happened to this request? | trace/spans and events | trace/request context, stage, outcome | request ID as metric label |
| Is overload controlled? | depth/age gauges, rejects, trace samples | queue, reason, capacity | “queue full” text without counts |
| Why did this operation fail? | structured error event | stable error class, source chain, context | formatted debug dump |
| Is the process serving safely? | readiness state plus traffic evidence | lifecycle state, dependency policy | liveness equals readiness |
| Where did the process panic? | panic event/backtrace and artifact | build ID, location, task/request context if available | raw backtrace in every error |
Metrics reveal populations and trends. Traces reconstruct selected causal paths. Events record discrete decisions or state changes. Profiles attribute resource use. Health endpoints expose a current process contract. They overlap, but making one signal impersonate all the others produces either missing context or explosive cost.
Events are records; text is one rendering
A structured event has a stable name and typed fields before any human-readable rendering:
name="relay.complete"
service="relay-service"
operation="ingest"
trace_id="7f…"
request_id="req-1842"
outcome="overloaded"
queue="persist"
queue_depth=512
limit=512
error_class="capacity"
schema_version=2
The message “persist queue is full” may be useful for a console, but parsers should not recover fields from prose. Stable event names and fields let consumers filter, aggregate, and evolve renderers independently. Fields describe domain and operating decisions, not every local variable.
Use bounded classifications. outcome=overloaded is a stable field; an entire error string is not. operation=ingest is controlled; a raw URL or topic name may have unbounded values. Record exact identifiers in events or traces only when policy permits and sampling/cost is controlled. Never copy authorization headers, secrets, credentials, or unreviewed payload bodies into telemetry.
The lab uses a typed outcome:
pub enum Outcome { Accepted, Overloaded, Invalid, Internal }
That enum limits the metric label vocabulary. Production schemas may need more classes, but every added value should answer a named question and have an owner.
Spans carry causal context across work
A span represents a period of work in a context; an event is a point within or related to that context. For a relay request, useful spans may cover admission, decode, classify, enqueue, persist, and acknowledge. Parent/child relationships describe causality more accurately than OS thread identity because async tasks can move between worker threads.
The signal map makes two boundaries visible at once: causal context crosses with owned work, while population and failure questions leave through different evidence channels.
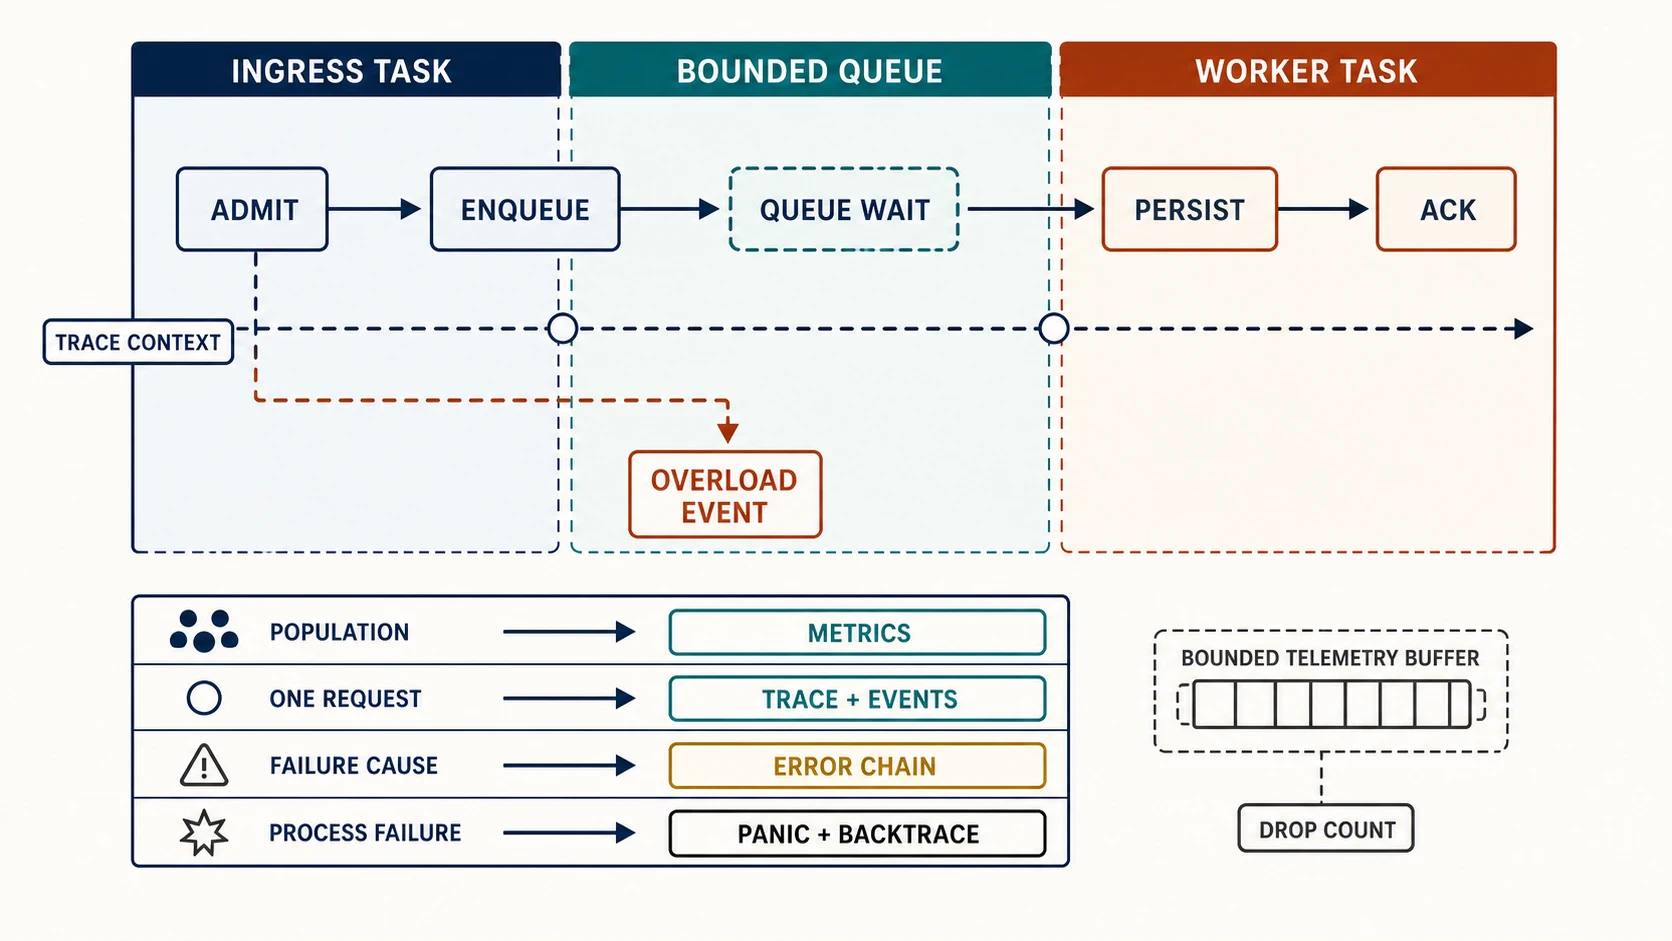
Create context at ingress from validated incoming trace headers or a new local trace. Keep an application request ID distinct from a trace ID: request IDs may support customer workflows, while trace IDs identify a telemetry graph. When placing work on a queue, send the context with the owned work item. At dequeue, create the worker span as a causal descendant or link according to the tracing model. A thread-local assumption is insufficient.
Current OpenTelemetry guidance defines propagation as serializing context across service or process boundaries, commonly using W3C Trace Context. Treat inbound baggage as untrusted input. Do not automatically propagate arbitrary baggage into logs, metrics, or downstream calls; validate names, size, privacy, and trust boundary.
Within Rust async code, attach a tracing span to the future. Holding a synchronous Span::enter guard across .await may associate other interleaved work with the wrong current span. #[instrument] and Instrument are convenient, but default argument recording can expose large or sensitive values. Use skip and deliberate fields.
Metrics need a cardinality and semantics budget
Each unique metric attribute combination can create aggregation state. A counter labeled by request_id, user ID, raw error message, or unconstrained path can grow with traffic and exhaust the SDK or backend. A cardinality budget is therefore a memory and cost budget, not a style preference.
For the relay, prefer dimensions such as:
- operation:
ingest,persist,shutdown; - outcome:
accepted,overloaded,invalid,internal; - queue: a small configured set such as
decodeorpersist; - error class: a controlled taxonomy;
- deployment metadata: service version, region, and environment attached as resource identity rather than repeated arbitrary labels.
Keep trace/request IDs in exemplars, sampled traces, or events when supported—not ordinary metric labels. Publish a cardinality estimate with every new dimension: the product of possible values, not merely the count per label.
Counters should be monotonic totals interpreted as rates over time. Gauges represent current values such as queue depth or in-flight requests and can miss transient peaks between scrapes. Histograms aggregate a distribution into buckets or another configured representation. For latency, histograms preserve the population shape needed for percentiles and SLO analysis; an average hides a small but severe slow tail.
Choose buckets from decisions. If the service objective is 100 ms and an overload deadline is 500 ms, buckets must distinguish behavior around those boundaries. Record units in names or metadata, and use one clock consistently. Aggregation configuration, temporality, bucket representation, and cardinality limits are SDK/backend semantics; capture their versions in the telemetry contract.
Preserve errors as chains, not duplicated strings
Rust’s std::error::Error::source represents a causal source chain. A boundary can add operational context—“persist batch”—while preserving an I/O timeout beneath it. Emit a stable outer class and, at an appropriate sampling level, the human-readable chain. Do not count every formatted chain as a separate metric outcome.
The lab walks the standard source relationship:
pub fn error_chain(error: &(dyn Error + 'static)) -> Vec<String> {
    let mut chain = vec![error.to_string()];
    let mut source = error.source();
    while let Some(error) = source {
        chain.push(error.to_string());
        source = error.source();
    }
    chain
}
Error telemetry should answer: which operation failed, which stable category applies, whether retry is safe, which attempt/deadline governed it, and what causal chain helps diagnosis. Avoid reporting the same error at every layer. Decide which boundary owns the event; lower layers preserve sources, and higher layers add domain meaning.
Backtraces answer where execution reached an error or panic, not why the domain operation failed. std::backtrace::Backtrace::capture is controlled by RUST_LIB_BACKTRACE and RUST_BACKTRACE, and capture can be expensive. Exact frames, symbols, filenames, and line numbers are best effort; debug information and matching artifacts affect usefulness. Capture selectively at the error-creation boundary when it earns its cost, or force capture only under an explicit diagnostic policy. Do not attach a new backtrace at every propagation layer.
Sampling is a policy, not random data loss
Keeping every trace and debug event is rarely affordable. Define what must never be sampled away, what may be probabilistically sampled, and what can be enabled temporarily.
- Keep aggregate counters and essential lifecycle transitions at bounded volume.
- Sample successful request traces at a controlled rate.
- Prefer retaining errors, overload, high-latency traces, and rare state transitions when the collector supports rule- or tail-based decisions.
- Rate-limit repeated identical events and emit a suppression count.
- Preserve sampling probability or decision metadata so analyses do not treat samples as complete populations.
Head sampling decides early and bounds downstream work, but it cannot know final latency or outcome. Tail sampling can keep interesting completed traces but requires buffering and moves cost into the collector. Adaptive sampling can protect budgets during incidents but complicates comparisons. Whichever policy you choose, test overload behavior and make dropped/sampled telemetry counts visible.
Redaction belongs before the sink
Telemetry often outlives application data and reaches more operators and vendors. Classify fields at instrumentation design time: public operational metadata, internal identifiers, personal data, secrets, and payload content. Allow-list safe fields. Hashing is not automatic anonymization; small or guessable domains can be reversed, and stable hashes still enable tracking.
Redact before buffering, formatting, or export so a failed exporter, crash dump, or local fallback does not retain the secret. Limit lengths and escape control characters. Treat error strings from dependencies as untrusted: they may include URLs, SQL, filesystem paths, remote payloads, or credentials. The lab’s tiny redact function only demonstrates where a policy boundary lives; real systems need reviewed field types and tests, not substring filtering.
Panic hooks report a failing process cautiously
Rust runs the configured panic hook when a thread panics under both unwind and abort strategies, before unwinding or aborting proceeds. A hook can emit panic location, payload classification, thread/task identity available at that point, build ID, and current trace context. It must be minimal and defensive. The process may already have corrupted application invariants, the allocator or exporter may be stressed, and another panic in the hook can worsen failure.
Do not synchronously call a remote collector from the hook. Prefer a bounded local mechanism, pre-opened crash channel, or stderr path integrated with the supervisor. Avoid locks also used by application telemetry. A panic event does not replace process supervision, exit-status capture, core/minidump policy, or a tested restart strategy.
Panic policy interacts with Chapter 86’s artifact contract. With panic = "abort", stack unwinding and cleanup do not occur. With unwinding, an uncaught panic can terminate a task or thread while the process continues, depending on where it occurs and how joins are handled. The telemetry contract must state which panics make readiness false, which terminate the process, and how operators find the affected request without assuming a thread name is causal context.
Liveness and readiness answer different questions
Liveness asks whether the process should be restarted. Readiness asks whether it should receive new work. Neither proves end-to-end correctness.
relay-service can be live but not ready while draining, warming required state, or unable to honor its admission contract. Readiness should depend only on conditions for which removing traffic is the desired response. If every replica marks itself unready because a shared dependency fails, traffic routing may amplify the outage without helping recovery.
Model lifecycle explicitly: starting, ready, draining, and terminal/not-ready. On shutdown, readiness usually turns false before admission closes; in-flight work then completes until a deadline; remaining work is cancelled or durably handed off according to policy. Emit one transition event with reason and deadline, plus gauges/counters for in-flight work and forced termination. Do not log a success message before joins and flush policies complete.
Telemetry must fail boundedly
An exporter is another networked subsystem. It can be slow, unavailable, rate-limited, misconfigured, or rejected for schema violations. Request processing must not wait indefinitely for it. Use a bounded telemetry queue, nonblocking or tightly bounded submission, batch export, retry limits with jitter, and a drop/degradation policy. Reserve memory explicitly.
The lab sink demonstrates one safe invariant:
pub fn emit(&mut self, event: Event) {
    if self.events.len() == self.capacity {
        self.dropped += 1;
        return;
    }
    self.events.push_back(event);
}
Dropping is not invisible success. Export a low-cost dropped-telemetry counter through an independent path where possible, rate-limit a local warning, and alert when loss defeats operating questions. Yet do not recurse: reporting that the reporter failed must not enqueue another event into the same full queue.
Choose the failure trade-off by signal. Dropping debug traces may be acceptable. Losing every overload counter may violate the operating contract. Security audit records can require a separate durable channel whose backpressure changes whether an operation is permitted. Name that distinction rather than applying one global “logs are best effort” rule.
Evolve schemas as public operational APIs
Dashboards, alerts, incident queries, retention jobs, and external consumers depend on event and metric schemas. Renaming a metric or changing units silently is a breaking change even when Rust compiles.
Prefer additive event fields. Keep names, units, label meanings, and outcome taxonomies stable. When semantics must change, introduce a new metric/event name or explicit schema version, dual-emit for a bounded migration window if cost permits, migrate consumers, then remove the old form. Track owners and removal dates outside application prose.
Test schemas. The fixture asserts that outcome labels remain bounded, request context survives the queue boundary, the sink cannot grow past capacity, and secrets are redacted before storage. Production tests should also snapshot field names, reject forbidden fields, calculate cardinality bounds, and exercise exporter failure, panic, overload, and shutdown.
Define the relay observability contract
Write a one-page contract with these five rows:
| State | Operator question | Required evidence | Bounds and privacy | Failure behavior |
|---|---|---|---|---|
| normal ingestion | rate, latency, result? | counter, histogram, sampled trace | bounded operation/outcome; no payload | trace may sample; totals persist |
| overload | where and why rejected? | queue depth/age, reject counter, event | bounded queue/reason | alert on telemetry loss |
| error | what failed and retry policy? | class, error chain, trace context | sampled strings; redact first | no duplicate layer events |
| panic | which artifact/context failed? | hook event, build ID, optional backtrace | minimal bounded local record | never remote-block or recurse |
| shutdown | did admission close and work drain? | lifecycle events, in-flight gauge, forced count | one event per transition | bounded flush, explicit loss |
For each field, name its producer, allowed values, unit, cardinality estimate, retention class, redaction rule, and consumer. Add a test or query that proves the signal answers its question. Then simulate a full telemetry queue, exporter outage, invalid incoming trace context, full work queue, panic during a request, and shutdown deadline. The contract is complete only if operators can reconstruct ordering without payload content and the service remains within its memory and latency budgets.
Operational review
- Does every event have a stable name and reviewed typed fields?
- Is causal context carried with queued/spawned work rather than inferred from threads?
- Are request, trace, and business identifiers distinct and absent from metric labels?
- Do latency metrics retain a distribution around decision thresholds?
- Are error categories bounded while source chains remain available at controlled volume?
- Is backtrace capture selective, symbol-aware, and treated as best effort?
- Are sampling decisions, drops, and exporter failures observable without recursion?
- Are secrets redacted before buffering or rendering?
- Do liveness, readiness, draining, and termination have separate semantics?
- Can schemas evolve without silently breaking alerts and queries?
Good telemetry does not explain every implementation detail. It preserves enough stable evidence to decide whether the next action is query, trace retrieval, profiling, traffic removal, rollback, or shutdown. The next operating boundary is the process that reads bytes and configuration, holds credentials, advertises readiness, and must drain under its deployment supervisor.
Sources and version notes
- OpenTelemetry signals distinguishes traces, metrics, logs/events, baggage, and emerging profiles.
- OpenTelemetry context propagation explains cross-process correlation and W3C Trace Context propagation.
- OpenTelemetry metrics documents aggregation, histograms, views, and the memory implications of attribute cardinality. Rust SDK stability and defaults are version-sensitive.
- Tokio tracing guidance demonstrates structured spans/events and deliberate field recording.
tracingdocumentation warns about synchronous span guards across.await; crate behavior is tied to the recorded version.std::error::Errordefines causal sources.std::backtracedocuments capture controls, cost, symbol requirements, and best-effort accuracy.std::panic::set_hookdocuments hook timing and behavior.
The fixture targets Rust 2024 and MSRV 1.85 without third-party dependencies. Production tracing, metrics, propagation, sampling, and export behavior must be revalidated against pinned crate, collector, backend, runtime, and platform versions.