The Rust Engineering Handbook / Chapter 86
Compiler Optimization, Inlining, LTO, PGO, and Code Size
Design Rust build profiles as deployment artifacts, balancing runtime, size, compile time, portability, failure behavior, and inspectability.
One source tree produces three correct executables. On the verification host, the default release artifact, a service-tuned artifact, and a size-tuned artifact have different byte counts, link times, symbols, panic behavior, and generated instructions. The smallest is not guaranteed to be fastest. The most aggressively optimized is not guaranteed to win the service workload. One may not run on an older processor if built for the host CPU.
That is the design decision. A build profile is not a “speed” switch. It selects an artifact contract across runtime performance, distribution size, startup, instruction-cache pressure, compilation latency, debugging, unwinding, portability, and reproducibility. The source remains necessary evidence, but production executes the linked artifact.
The governing rule is: name the deployment and workload first; vary one build dimension against a reproducible baseline; preserve correctness and operational behavior; inspect generated code to explain observations, never to redefine Rust semantics. Profile settings are hypotheses offered to an optimizer and linker. Only measurements on identified artifacts decide whether they help.
Begin with an artifact decision record
The chapter lab declares three profiles:
[profile.service]
inherits = "release"
opt-level = 3
lto = "thin"
codegen-units = 1
panic = "unwind"
strip = "none"

[profile.small]
inherits = "release"
opt-level = "z"
lto = "fat"
codegen-units = 1
panic = "abort"
strip = "symbols"
These are comparison candidates, not recommendations. The service profile preserves unwinding and symbols while asking for cross-crate thin LTO and one codegen unit. The small profile optimizes for size, requests fat LTO, aborts on panic, and strips symbols. Each choice changes more than a benchmark score.
Before building, record the intended use:
| Artifact question | Throughput service | Small CLI |
|---|---|---|
| Primary budget | steady-state capacity and tail latency | download/install size and startup |
| Portability | fleet CPU baseline | unknown user CPUs |
| Panic policy | supervisor and cleanup contract | simple fail-fast may be acceptable |
| Symbol needs | production profiling and crash analysis | separate debug artifact may suffice |
| Build frequency | controlled release pipeline | release and contributor builds |
| PGO workload | representative sustained traffic | realistic command mix and startup |
This prevents a common mistake: applying a profile that solved one artifact’s constraint to every binary in a workspace. A command-line migration tool, long-running service, plugin library, and embedded image may need different answers.
The compilation pipeline has multiple optimization boundaries
Rust source is parsed, expanded, type-checked, and lowered through compiler representations before LLVM code generation, object production, and linking. Cargo orchestrates crates, features, build scripts, profiles, and linker invocation. Generic functions are instantiated for concrete types that are actually used. Code is divided into codegen units. Optimization can occur within a unit, across units in a crate, or across crates when link-time optimization carries the necessary representation forward.
Use the pipeline as a visibility map: the lower lanes show where profile settings and representative workload evidence can change the final artifact without changing Rust’s language semantics.
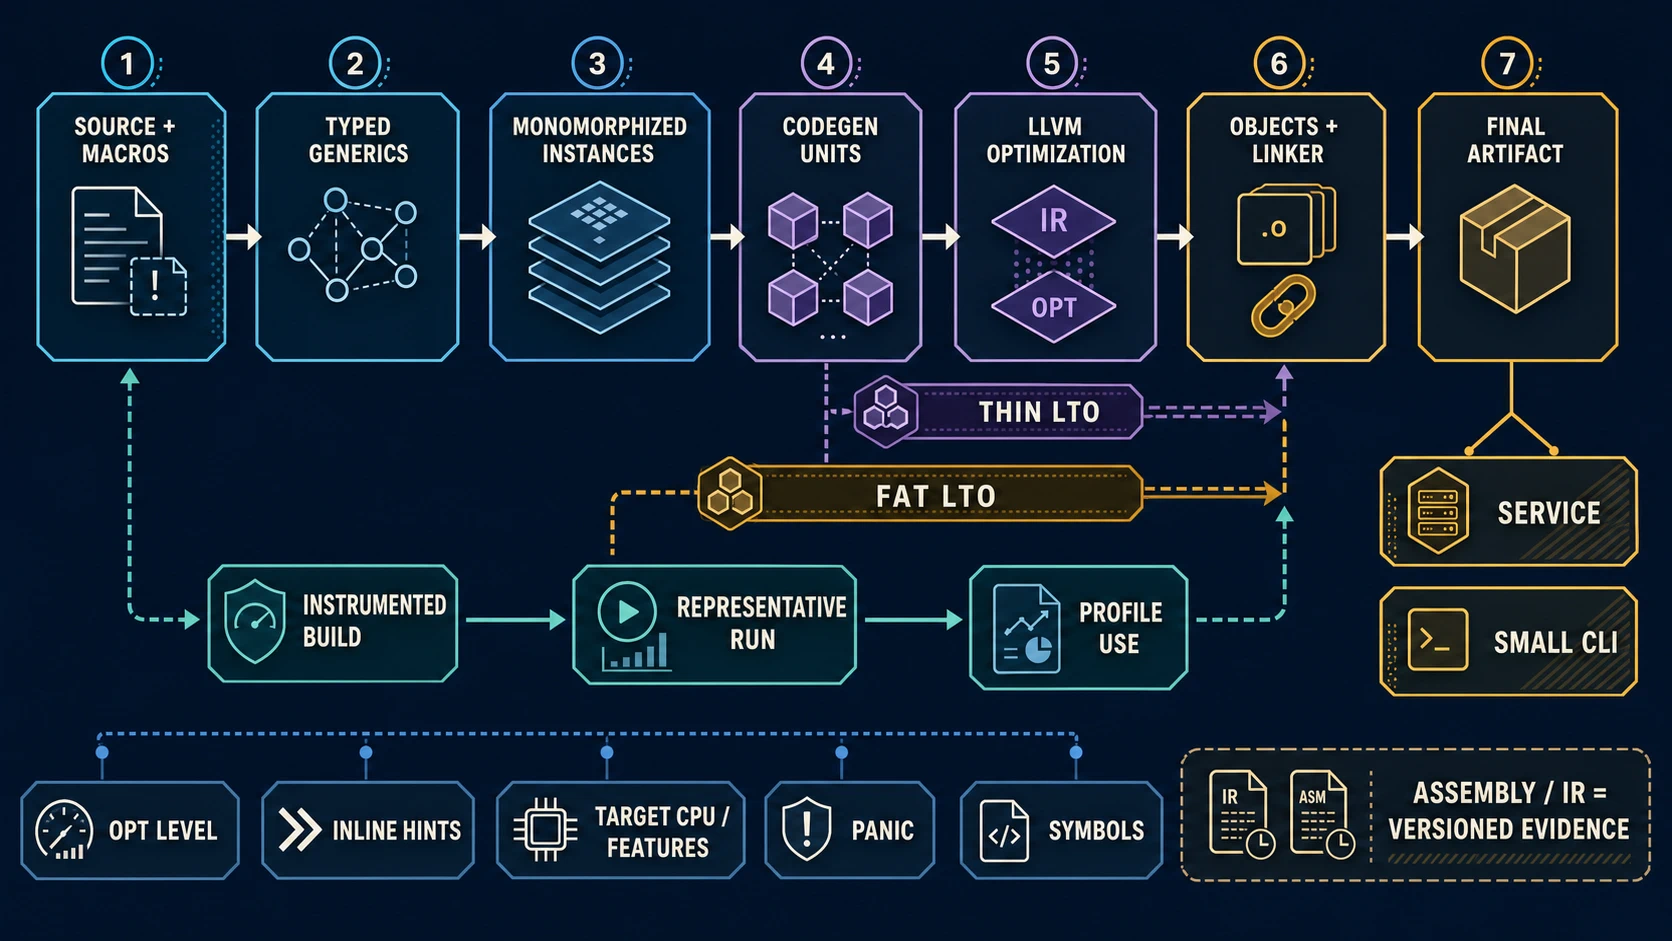
Each boundary affects opportunity and cost. More codegen units permit more parallel compilation but can limit optimization across unit boundaries. LTO widens visibility at link time but consumes time and memory. Inlining removes a call boundary and exposes surrounding code, but duplicates bodies and can worsen instruction-cache behavior. Monomorphization specializes generic code, but repeated concrete instances consume compile time and space.
Do not describe the pipeline as a stable sequence of particular LLVM passes. Rust’s language contract does not require LLVM, a symbol spelling, a fixed intermediate representation, an inlining threshold, or an instruction sequence. The durable engineering model is visibility: which facts are available when an optimization decision is made, and what costs accompany making more facts available?
Spend optimization visibility deliberately
Optimization levels are different strategies
Cargo profile opt-level maps to compiler optimization choices. 0 favors development turnaround and debugging; 1, 2, and 3 enable increasing sets or aggressiveness of optimizations; "s" and "z" optimize for size, with "z" also disabling loop vectorization according to current Cargo documentation. Higher is not a total ordering of runtime speed. Level 3 can produce larger code, alter vectorization or unrolling, and behave worse for a specific cache-sensitive workload. Size modes are not guaranteed to produce the smallest artifact after linking and stripping.
Test the profile that matters. cargo test normally uses the test profile inherited from development settings. A fast unit test does not demonstrate release performance, and a release build does not exercise cfg(test) code. Correctness should pass under ordinary tests; performance evidence should run the optimized artifact built by the candidate profile. If overflow checks, debug assertions, or panic behavior are part of the production contract, configure and test them explicitly.
Also separate compile time into clean build, incremental edit/build, and link time. A one-codegen-unit fat-LTO build may be acceptable in a nightly release pipeline and intolerable in a developer feedback loop. Teams sometimes keep a fast developer profile, a representative profiling profile with debug information, and a release profile whose extra expense is paid only at release.
Inlining is a budget, not a virtue
Inlining can remove call/return overhead and, more importantly, expose constants, aliases, loops, and concrete types to surrounding optimization. That can enable constant propagation, vectorization, dead-code elimination, or bounds-check elimination. It can also duplicate a body into many callers, increase compile time, enlarge instruction working sets, and make profiles or debugging harder to interpret.
Rustc already applies inlining heuristics. #[inline], #[inline(always)], and #[inline(never)] are hints under the Rust Reference, and the compiler may ignore them. An attribute does not create a semantic guarantee or a portable performance result.
Use restraint:
- Prefer no attribute for private functions until evidence identifies a boundary.
- Consider
#[inline]for small public generic or cross-crate helpers only when the downstream optimization opportunity is material and measured. - Reserve
#[inline(always)]for exceptional, inspected cases with code-size evidence across supported targets. - Use
#[inline(never)]as an experiment or deliberate cold/error-path boundary, not as a universal profiling trick.
The important comparison is not “call present versus absent” in one assembly listing. Measure the complete workload and artifact size. An inlined parser helper may remove checks and accelerate a hot loop. Inlining an error formatter into dozens of callers may grow cold code and evict useful instructions. #[cold] can express that a function is unlikely to execute, but it too is a hint whose artifact effect must be inspected.
Cross-crate behavior adds nuance. Generic function bodies and some inlineable representations can be available to downstream compilation, while an ordinary non-generic call may remain opaque without LTO. Public API design should not be contorted solely to force optimization. A stable erasure boundary can be worth more than a small local speedup.
Monomorphization spends code size for specialization
When a generic function is used with multiple concrete types, the compiler can produce concrete instances. Static dispatch and specialized layout information can improve optimization. The lab deliberately retains both generic and trait-object classification paths so emitted symbols and code can be compared.
The cost grows with the cross-product of types, generic layers, and call sites that survive deduplication. A generic serializer instantiated for many writers, formats, and policy types can create substantial machine code. Iterator chains may generate distinct types for each composition. This is not automatically waste: specialized hot paths may justify it. The question is whether the variability needs to remain static through the whole stack.
Contain code-size growth by choosing an intentional boundary. A small generic outer function can normalize input and call a non-generic inner function. A trait object or function pointer can erase types after the specialization that matters. An enum can represent a closed set of variants with static matching. None is always smallest or fastest.
Inspect the actual artifact. nm -C --size-sort can show demangled symbols on supported object formats; size, readelf, platform object tools, or linker maps can attribute sections and retained code. Symbols can be folded, stripped, internalized, or absent, so absence from nm does not prove absence of behavior. A tool’s view is part of the evidence chain, not the language model.
Codegen units trade parallel compilation for visibility
Rustc partitions a crate into codegen units. More units can compile in parallel, reducing wall-clock compilation on available cores. The partition can prevent some optimizations across units and can interact with duplication and incremental compilation. Current Cargo defaults differ for incremental and non-incremental builds; record the effective value rather than relying on memory.
Setting codegen-units = 1 gives the optimizer a wider within-crate view but serializes more code generation and can increase build latency. It is a candidate for release artifacts, not a ritual. Large workspaces may find that thin LTO with several units provides a better balance. Small crates may show no meaningful runtime change.
Measure clean builds with an isolated target directory and sufficient repetitions to see filesystem-cache variation. Do not compare a warm incremental candidate build with a cold baseline build. Record CPU count, memory pressure, linker, incremental setting, and whether dependencies were already built. Compilation is itself a workload.
Thin and fat LTO widen the link-time view
Link-time optimization preserves intermediate representation long enough to optimize across boundaries that ordinary separate compilation cannot see. Cargo distinguishes lto = "thin", lto = "fat", lto = false, and lto = "off"; notably, current documentation says false can still perform thin local LTO across a crate’s codegen units when optimization and unit settings permit, whereas "off" disables it.
Thin LTO summarizes modules and imports selected work, usually offering a smaller build-time cost than fat LTO. Fat LTO attempts a more global optimization and can consume considerably more time and memory. Either can improve runtime, reduce code, do little, or regress a workload. Linker behavior, native dependencies, and platform format matter.
LTO can internalize or remove symbols, complicate debugging, and change stack profiles. Preserve sufficient debug information or a separate unstripped artifact for production observability. Validate dynamic exports, plugin entry points, FFI symbols, and linker scripts: a function needed outside the Rust call graph may require explicit export/retention semantics. Edition 2024 treats attributes such as no_mangle and export_name as unsafe attributes because symbol collisions and placement can violate safety.
Cross-language linker-plugin LTO is a separate integration problem. Cargo does not make every C/C++ archive transparently optimizable with Rust simply because lto = "thin" is present. Align compiler bitcode, linker, archive, and deployment toolchains deliberately.
Target CPU and features define portability
-C target-cpu selects a processor model for code generation, and -C target-feature enables or disables target-specific features. target-cpu=native asks the compiler to use the build host’s CPU capabilities. That can be valuable for a binary built and run on the same controlled machine. It is dangerous for a generic container image, downloadable CLI, or fleet spanning processor generations: the binary may execute instructions unavailable on another host.
Define a fleet baseline such as an architecture level supported everywhere, then consider separate optimized artifacts or runtime feature detection for hot kernels. The standard library provides architecture-specific detection macros on supported platforms. A function annotated with #[target_feature] carries call-safety constraints; executing unsupported instructions can be undefined behavior on architectures such as x86/x86-64 according to the Reference. Encapsulate detection and fallback, and test both paths.
Target features also interact with dependencies and the standard library. Passing flags for the local crate does not necessarily rebuild every precompiled component with the same features. Record the complete command and distribution assumptions. “Works in CI” is not portability evidence if CI has a newer CPU than production.
CPU tuning is not a SemVer property of source. It belongs in artifact identity: target triple, baseline CPU, enabled features, compiler, and deployment ring.
Keep optimization inside the operating contract
Panic strategy changes failure and linking behavior
With unwinding, a panic can run destructors while traversing Rust frames and may be caught at an appropriate Rust boundary with catch_unwind, subject to unwind-safety and panic-runtime constraints. With panic = "abort", a panic terminates the process without unwinding. Abort can reduce binary size and remove unwind machinery, but size is not guaranteed and operational semantics change.
Choose from the failure contract. A small CLI may accept process termination and rely on filesystem-safe protocols. A multi-tenant service may also prefer fail-fast isolation under a supervisor, or it may require unwinding to release in-process resources and contain a plugin fault. Unwinding across an FFI boundary requires explicit ABI and boundary handling; do not infer safety from profile choice.
Test panic paths for each shipped profile. Verify exit status, partial-output behavior, logs, crash reports, lock/transaction cleanup, and supervisor restart. A benchmark that never panics cannot approve this setting. Binary-size savings do not pay for corrupted output or an invalid recovery model.
PGO uses a workload as optimizer input
Profile-guided optimization compiles an instrumented program, runs it to collect execution counts, merges profiles, and recompiles using that data. The optimizer can use branch frequency and hotness when making layout, inlining, and other decisions. This can improve a stable workload; an unrepresentative training run can optimize the wrong paths.
The rustc book documents a four-stage workflow: instrument, execute representative scenarios, merge raw profiles with the matching LLVM profile tool, then rebuild with -Cprofile-use. The lab README isolates instrumented and optimized target directories and enables missing-function warnings during profile use. That isolation matters: mixing instrumented dependencies or stale profile data can produce misleading artifacts.
Treat the profile as a versioned experimental input. Record:
- source, compiler, LLVM tooling, target, features, and profile settings;
- scenario mix, data provenance, weights, duration, and environment;
- coverage of startup, steady state, errors, rare but expensive paths, and shutdown;
- missing-profile and out-of-date-profile warnings;
- raw and merged profile hashes;
- correctness tests and benchmark protocol for the final artifact.
Train and evaluate on distinct samples when possible. If the same tiny data set is used for both, the result can reward over-specialization. Compare non-PGO and PGO artifacts with Chapter 84’s controlled protocol. Recollect profiles when code or workloads change materially. PGO is not a one-time blessing attached to a repository.
PGO also raises release-pipeline questions: profiles may contain sensitive path or behavior metadata, builds need matching tools, and nondeterministic workload collection can complicate reproducibility. Decide whether the gain repays that governance burden.
Symbol visibility and stripping affect operation
Rust produces many internal, mangled symbols as implementation details. Linkers can internalize, discard, fold, or export them according to artifact type, references, visibility, attributes, and platform rules. Public Rust visibility (pub) is a language/module concept; it is not by itself a stable C ABI or a promise that a named dynamic symbol will remain.
Stripping removes some symbol/debug information from the distributed artifact and can reduce size. It can also make stack traces, crash dumps, profiling, and incident response far less useful. A common compromise is to distribute a stripped binary while retaining a securely indexed unstripped or split-debug artifact keyed by build identity. Confirm that the production profiler and symbolizer can recover function names and source locations before stripping becomes policy.
For deliberate foreign exports, use an explicit ABI, ownership contract, version policy, and the required unsafe attribute syntax. Verify the dynamic symbol table with platform tools and run a linked smoke caller. Do not keep symbols accidentally merely to satisfy a test that inspects current mangling.
Link-time garbage collection can remove unreachable sections. Dynamic registration, reflection-like tables, linker scripts, interrupt vectors, and plugin discovery may create reachability the Rust call graph cannot see. Use the platform’s supported retention mechanism and test the final linked image.
Binary size has several meanings
stat reports file bytes. size reports selected loaded sections on common object formats. Compressed package size measures distribution. Resident memory includes mapped pages, relocations, allocator state, stacks, and shared libraries. Cold-start I/O depends on pages touched, storage, and cache state. Choose the metric tied to the decision.
Debug information can dominate file size without being mapped into steady-state memory. Stripping can make a dramatic stat improvement without changing hot instructions. Static linking can enlarge a file while simplifying deployment. Dynamic linking can share pages across processes but adds compatibility and startup relationships. LTO may remove code yet lengthen builds. Size optimization may reduce instruction footprint but inhibit vectorization.
Use a size budget by component. A linker map or section/symbol report can reveal whether growth comes from monomorphization, formatting, panic/unwind tables, debug data, native libraries, or embedded assets. Track changes against a clean baseline and explain rebaselines. An unexplained 2 MiB increase should not be hidden by a generous absolute ceiling.
The lab’s artifact commands are intentionally plain:
cargo build --release
cargo build --profile service
cargo build --profile small
stat -c '%n %s bytes' target/release/cost-model-lab \
  target/service/cost-model-lab target/small/cost-model-lab
size target/release/cost-model-lab target/service/cost-model-lab \
  target/small/cost-model-lab
Run them on one clean host, retain the commands and outputs, and interpret differences with profile metadata. Never copy one host’s byte counts into a universal claim.
Assembly and IR answer narrow questions
Generated assembly can answer whether a particular artifact contains an indirect call in one hot function, whether a bounds check remains, whether vector instructions appear, or whether a helper was inlined. LLVM IR can expose optimization opportunities and transformations at a different stage. Neither is a suitable first tool for an unexplained service slowdown. Once the artifact is identified, investigation should begin from the suspected resource and select evidence that can falsify that hypothesis.
Emit identified artifacts:
cargo rustc --profile service --lib -- --emit=asm
cargo rustc --profile service --lib -- --emit=llvm-ir
Keep the rustc verbose version, target, flags, profile, features, and source revision. Search for the function or use a tool that correlates source and assembly, but account for inlining, mangling, multiple codegen units, and dead-code elimination. A function may not exist as a standalone symbol because it was inlined or removed. Several versions may exist because of monomorphization.
Avoid fragile tests that assert exact instructions or symbol spellings unless maintaining a target-specific low-level component where that artifact is the product. Even then, scope the test to named targets and toolchains. For ordinary application code, test semantics, benchmark the relevant outcome, and use assembly as explanatory evidence during an investigation.
Compare profiles without changing the question
Build a decision dossier for both the service and small CLI:
- Pin source, lockfile, Rust version, target, linker, features, and environment.
- Define correctness and operational gates, including panic and symbolization behavior.
- Build each profile into an isolated, clean target directory and record clean build plus link time.
- Record file, section, and compressed-package size using named tools.
- Run the same representative workloads with randomized or interleaved order.
- Capture throughput, latency distribution, startup, peak memory, and guardrails relevant to the artifact.
- Inspect symbols and generated code only where results need a mechanism explanation.
- For
target-cpuor features, run on every supported CPU class or retain a generic fallback. - For PGO, document training coverage and evaluate on held-out representative inputs.
- Choose a profile, record rejected alternatives, and state rollback thresholds.
A reasonable service decision might prefer thin LTO and one codegen unit only if capacity improves beyond noise, release build time remains within budget, production symbols remain usable, and tail latency does not regress. A small CLI decision might prefer opt-level = "z" and stripping if package size and cold start improve, unsupported CPUs remain supported, panic-abort matches the file-safety model, and a separate symbol artifact preserves incident diagnosis.
There is no shame in keeping Cargo’s default release profile. Complexity needs evidence too. Every custom flag becomes compatibility and maintenance surface across compiler upgrades.
Review the artifact, not the folklore
- Is the profile tied to one named deployment and workload?
- Are runtime, size, compile time, portability, panic behavior, and debuggability all represented?
- Were candidate artifacts built from identical source, dependencies, features, and target assumptions?
- Are optimization levels treated as strategies rather than a speed ranking?
- Does an inline attribute have call-frequency, benchmark, and code-size evidence?
- Is monomorphization growth attributed to concrete instantiations and contained at a deliberate boundary?
- Were codegen-unit and LTO comparisons clean and isolated?
- Is
lto = falsedistinguished fromlto = "off"under current Cargo behavior? - Does the target CPU policy match the oldest supported machine?
- Are runtime-detected feature paths tested with a fallback?
- Does panic strategy satisfy cleanup, FFI, supervisor, and partial-output contracts?
- Is PGO trained on representative, versioned workloads and evaluated independently?
- Can deployed artifacts still be symbolized and profiled?
- Are file size, loaded sections, package size, and resident memory kept distinct?
- Are assembly, IR, symbols, and timings labeled with toolchain and target identity?
- Is there a rollback threshold after compiler or workload changes?
Optimization is an artifact-governance practice. Source structure exposes or hides information; compiler and linker settings trade visibility against build and code-size costs; workload profiles add empirical bias; deployment requirements decide which trade is acceptable. The next step is to investigate where the running artifact actually spends resources, selecting CPU, memory, I/O, lock, or async-task evidence according to the suspected bottleneck.
Sources and version notes
The fixture targets Rust 2024, stable Rust 1.97.0, and Rust 1.85 as MSRV. Cargo defaults, rustc code generation, LLVM behavior, linker behavior, symbol formats, target features, and emitted assembly/IR are version- and platform-sensitive. Re-run the comparison after compiler, linker, dependency, target, profile, or representative workload changes.
- Cargo Book: profiles
- rustc book: code generation options
- rustc book: profile-guided optimization
- Rust Reference: code-generation attributes
- Rust Reference: application binary interface and exported symbols
- Rust Reference: target features
- Rust Performance Book: build configuration
- Cargo Book: build cache and clean builds