The Rust Engineering Handbook / Chapter 85
Rust’s Cost Model: Allocation, Copies, Dispatch, Syscalls, and Caches
Predict where a Rust request path spends time and memory, then turn that ranking into measurements instead of folklore.
Before the profiler runs, write the relay worker’s first cost ledger:
one record: borrow bytes -> classify through a trait -> format one audit line -> write to socket
observed wall time: 38 microseconds
unknowns: allocations, bytes copied, dispatch frequency, writes, flushes, cache misses
The ledger cannot yet name the dominant operation, but it can force a ranked prediction and a falsifier. If the socket is flushed for every record, the kernel crossing and downstream backpressure probably dominate. If output is batched, formatting and allocation may become visible. If the working set exceeds cache, a compact parser can lose to memory stalls. If the trait call surrounds substantial work, dispatch is unlikely to matter; if it sits inside a tiny loop, it might obstruct inlining and amplify.
Rust’s cost model is not a price list. It is a path model: count expensive events, locate them in the frequency hierarchy, account for bytes and sharing, and keep compiler transformations and machine behavior as measured facts rather than semantic promises. A nanosecond saved inside an operation executed once per request cannot repay a syscall accidentally executed a thousand times. Conversely, one allocation in a cold configuration path may deserve no attention at all.
The goal is not to optimize by inspection. It is to make a better first prediction, select the right evidence, and notice when a “zero-cost” abstraction has moved cost somewhere else.
Trace the request before pricing an instruction
Start with the lifecycle of data and effects. The chapter lab’s request owns a payload and trace identifier. Classification can use a generic classifier or a trait object. Encoding can allocate a new String or reuse a caller-owned byte buffer. Output can issue many writes through a buffered adapter. The same result checksum lets the alternatives be compared without silently changing behavior.
An initial cost ledger might look like this:
| Stage | Events to count | Bytes or state to record | First evidence |
|---|---|---|---|
| Receive | reads, wakeups, syscalls | batch and buffer sizes | syscall trace, queue telemetry |
| Decode/classify | branches, loads, bounds checks, calls | input distribution, working set | CPU profile, counters, assembly only if needed |
| Own/share | allocations, reallocations, clones, refcount operations | allocated and retained bytes | allocation profile |
| Encode | formatting calls, temporary values, growth | output-length distribution | allocation counts, CPU samples |
| Emit | writes, flushes, locks | bytes per write, queue depth | syscall trace, latency under load |
| Coordinate | atomic updates, cache-line ownership transfers | thread placement and update rate | scaling curve, hardware counters |
The frequency hierarchy is decisive. Record per deployment, process, connection, batch, request, field, and byte separately. “One clone” says little until the cloned type and frequency are known. “One virtual call” can mean one call around a database operation or one call per byte.
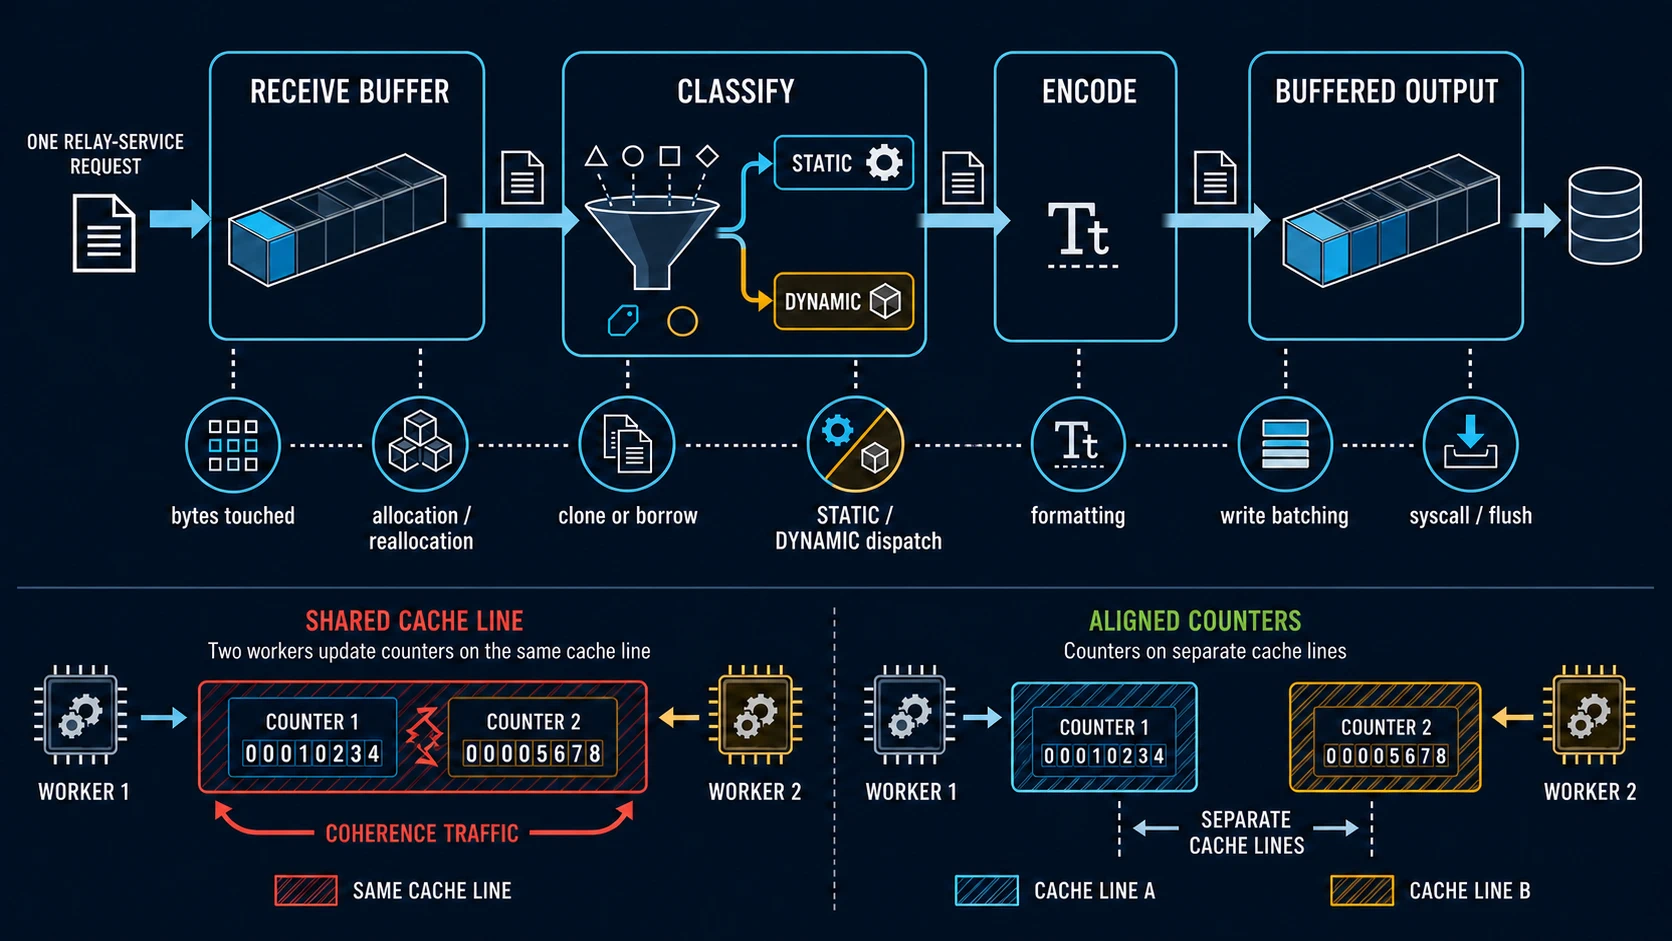
The diagram is a hypothesis map. It does not say every label is expensive. It shows where to attach counts and observations.
Stack and heap describe placement, not speed
Local variables are often represented in a function’s stack frame, while Box, Vec, String, Rc, and Arc commonly lead to heap storage. That distinction is useful but incomplete. Optimized code may keep fields in registers, eliminate values, or inline frames. Stack growth can fault pages and overflow bounded stacks. Heap allocation can be cheap on a thread-local fast path or expensive under contention and reclamation. Cache behavior depends on what memory is touched, not which vocabulary word described its origin.
For a Vec<T>, the small owner value contains a pointer, length, and capacity; non-zero-sized elements live in a contiguous allocation when capacity is nonzero. Moving the Vec transfers those fields. It does not semantically clone its elements. The lab verifies the practical distinction by observing that a moved vector retains its element pointer while a deep clone receives a separate allocation. The pointer observation teaches this concrete type on this run; the durable contract is that move makes the source unavailable and transfers ownership, not that every move is implemented as a particular byte copy.
Large stack values can still be copied when their type is Copy, passed according to an ABI, or transformed by optimization. Small heap-owning handles can move cheaply while pointing to megabytes. Review both the owner representation and the referent.
Ask three different questions:
- What storage must exist according to the type’s contract?
- What allocation or copying events occur on the exercised path?
- What loads, stores, and cache lines does the generated artifact actually use?
Conflating them produces claims such as “borrowing keeps data on the stack” or “moving is free.” Borrowing changes access and lifetime rights; it does not choose a physical region. A move has no destructor-like deep duplication requirement, but it may still entail machine work, and that work may matter for a large inline value in a hot loop.
Clone names a contract, not a cost class
Clone means explicit duplication according to the type’s implementation. For u64, it is trivial. For a nonempty Vec<u8> or String, it normally allocates storage and copies elements or bytes. For a tree, it can traverse and allocate recursively. For Arc<T>, cloning normally increments the strong count and copies the pointer-like handle; it does not clone T or allocate a second T.
That makes “remove clones” a poor review instruction. Determine what is cloned, why ownership is needed, and whether the clone appears in a measured hot path. A clone can be the right price for isolating work, simplifying cancellation, or shortening a lock lifetime. Replacing it with a borrow may spread lifetimes through an API or retain a much larger backing buffer. Replacing it with Arc trades deep duplication for allocation, atomic reference-count traffic, indirection, and shared lifetime.
The relevant quantities include clone count, bytes copied, allocation count, allocation lifetime, retained capacity, and thread handoff. clone_from may reuse existing capacity for types such as Vec, but that is useful only when the destination’s reuse policy matches the workload. Reusing a peak-sized buffer can eliminate allocations while inflating steady-state memory.
Allocation cost includes growth and retention
Allocation is not merely the call to an allocator. It includes finding storage, metadata work, possible synchronization, initialization of bytes the program touches, cache and translation effects, and later destruction or reuse. A reallocation may allocate a larger block, move elements, and release the old block. Vec::with_capacity and reserve can reduce growth events when a defensible size estimate exists; over-reserving multiplies memory footprint across concurrent requests.
Instrument at least allocation calls and requested bytes, then consider peak live and retained bytes. A zero-allocation steady-state loop can still retain an unbounded buffer. An arena can turn many individual frees into one release but increase peak lifetime and make accidental retention harder to see. A small-buffer representation can save common-case allocations while enlarging every owner and increasing move traffic.
Formatting deserves explicit attention because it hides work behind ergonomic syntax. format! produces a new String. Decimal conversion performs computation. Repeated growth may allocate. Writing with write! into a reusable String or Vec<u8> can reuse capacity, while format_args! can pass formatting arguments without first creating an owned string. Neither guarantees zero cost: the destination may grow, formatting still executes, and generic writer layers may or may not inline.
The lab exposes both shapes:
pub fn encode_owned(summary: Summary, trace_id: &str) -> String {
    format!("{trace_id},{},{},{}\n", summary.class, summary.payload_len, summary.checksum)
}

pub fn encode_reused(summary: Summary, trace_id: &str, output: &mut Vec<u8>) {
    output.clear();
    output.extend_from_slice(trace_id.as_bytes());
    writeln!(output, ",{},{},{}", summary.class, summary.payload_len, summary.checksum)
        .expect("writing to Vec cannot fail");
}
The reused path is not automatically superior. It introduces mutable buffer ownership, retains capacity, and may complicate concurrency. It earns its place when allocation evidence and lifecycle design support it.
Reference counting exchanges copies for shared traffic
Rc is for single-threaded shared ownership; Arc supports atomic reference counting across threads when its contained type satisfies the required thread-safety contracts. Both usually place the shared value and counts behind indirection. Cloning an Arc does not clone the payload, but the count update is observable shared-memory work. Dropping handles updates counts and the final drop destroys the value.
An isolated atomic increment is often small compared with I/O or parsing. Under high fan-out, a shared count can become a contended cache line. The cost depends on clone/drop frequency, core topology, memory ordering in the implementation, and whether other fields share the line. Do not infer it from the type name. Measure scaling as threads increase and compare ownership alternatives that preserve semantics.
Credible alternatives include:
- clone a small immutable configuration into each worker, paying copies but avoiding shared count traffic;
- keep an
Arcper long-lived worker, cloning only at setup rather than per request; - pass a scoped borrow when the owner naturally outlives all work;
- move unique ownership through a channel when there is one consumer.
Each choice changes shutdown, retention, and API constraints. Performance is part of the ownership design, not an afterthought detached from it.
Static and dynamic dispatch move different constraints
A generic function such as classify_static<C: Classifier> can be monomorphized for concrete C. This enables static dispatch and may expose the callee to inlining and specialization by optimization. It can also duplicate machine code across concrete instantiations, increase compilation and binary size, and spread generic types through APIs.
A &dyn Classifier uses dynamic dispatch through trait-object metadata. The indirect call can inhibit inlining and may be harder for branch prediction when concrete callees vary. It also provides runtime heterogeneity, a stable erasure boundary, and one shared caller body. The dispatch itself is often irrelevant when the method performs substantial parsing or I/O. It becomes more plausible when a tiny method is invoked at byte, element, or packet frequency.
The lab keeps both paths and asserts equal checksums. That is important: changing a trait object to an enum or generic parameter can alter construction, code layout, and supported extensibility. A fair experiment compares the decision boundary the system can actually adopt.
Monomorphization belongs on both the runtime and code-size ledgers. More specialized code may run faster yet increase instruction-cache pressure. That trade must be examined in the linked build artifact rather than inferred from generic source alone.
Iterators and bounds checks require artifact evidence
Rust iterators can express loops in a form the optimizer understands well. Adapters are commonly inlined, and a chain may compile to a simple loop. That is a frequent outcome, not a language guarantee that every iterator is “zero cost.” Captured state, opaque boundaries, dynamic dispatch, complicated adapters, and inhibited inlining can change the result.
Indexing a slice performs a bounds check unless the compiler proves it redundant. Iteration can make valid ranges apparent, but indexed loops can also have checks eliminated. Unsafe unchecked indexing removes a check by transferring the proof obligation to the programmer; it is rarely the first repair. Reshape the loop, use slice operations, hoist a checked range, or expose lengths to the optimizer, then inspect and measure.
Avoid source-level counting of checks. One slice[i] in source might have no check in optimized assembly; a seemingly clean abstraction might retain several. Tests establish correctness, benchmarks establish effect, and assembly or IR can explain a specific artifact. None of those emitted forms becomes a promise for the next compiler release.
Branches follow the same rule. A predictable branch can be cheap; an unpredictable branch can disrupt a pipeline. “Branchless” code may execute more instructions, prevent vectorization, or behave worse on common inputs. Record branch-driving input distributions. A parser tested on one repeated delimiter pattern teaches the predictor a workload production may not have.
Syscalls and buffering change the unit of work
System calls cross a user/kernel interface and often interact with scheduling, devices, networking, filesystems, or readiness state. The operation behind a call can dwarf CPU-level choices. Count calls and bytes per call before polishing an inner loop.
BufWriter<W> accumulates small writes and sends larger writes to its inner writer. This can reduce syscall frequency when W ultimately maps writes to the operating system. It does not guarantee that one flush equals one physical device operation, one network packet, or durable storage. flush follows the wrapped writer’s contract; file durability may require stronger operations, and network buffering exists at multiple layers.
Buffering has costs: memory, copy into the buffer, delayed visibility, explicit flush/error handling, and potentially burstier latency. Line-buffering, batch size, timeout, and shutdown behavior are operational policy. Losing an error during a destructor-driven flush can lose data; explicit flush at a meaningful boundary makes failure visible.
For async I/O, a write call may enqueue or copy rather than block in a syscall at that exact line. Executor wakeups, batching, socket buffers, and backpressure define the path. Use runtime spans, syscall tracing, and queue telemetry together rather than attributing all latency to the Rust method call.
Locality can dominate elegant abstractions
Processors fetch memory in cache-line-sized regions and exploit spatial and temporal locality. Exact cache sizes and line sizes are target properties, not Rust guarantees. Still, representation shapes access.
An array of records keeps each record’s fields together. That is effective when most fields are consumed together. If a hot loop reads only tenant, flags, and payload length while each record also owns a trace identifier and buffer, interleaving cold owner fields increases the bytes pulled through caches. Splitting hot metadata from cold payload ownership can make the hot pass denser:
pub struct HotRequest {
    pub tenant: u32,
    pub payload_len: u32,
    pub flags: u8,
}

pub struct ColdRequest {
    pub trace_id: String,
    pub payload: Vec<u8>,
}
The split adds index correlation and may make whole-record operations worse. It can also complicate mutation and removal. Apply it to measured access patterns, not as a universal data-oriented style.
False sharing is a different locality failure. Two threads update independent atomic counters that happen to occupy one hardware cache line. Coherence transfers the line between cores even though the logical variables do not overlap. Padding or #[repr(align(64))] can separate them on a machine with a common 64-byte line, but 64 is an explicit deployment assumption and padding increases memory footprint. The lab’s aligned counter is a demonstration, not a portable guarantee that every target’s destructive-interference size is 64 bytes.
The useful evidence is a scaling curve plus cache-coherence or miss counters on the target system. If throughput collapses with more writers and recovers when counters are sharded or separated, the representation was causal. A microbenchmark of one thread cannot reveal false sharing.
Zero-copy transfers lifetime and pressure
“Zero-copy” usually means eliminating one or more application-visible copies, not proving that no byte moves anywhere. Network interfaces, kernels, devices, decompression, parsing, and caches may still copy or transfer data. The term needs a boundary: zero copy between receive buffer and parser, between parser and application value, or between user and kernel space?
Borrowing a field from an input buffer can avoid allocation and duplication. It also ties the field’s lifetime to that buffer. If one small field keeps a 1 MiB receive buffer alive across an async task, retained memory may exceed the cost of copying 24 bytes into an owned value. Buffer pools amplify the issue: one long-lived borrower can starve the pool and turn a local saving into system backpressure.
Other trade-offs include fragmented access, alignment, validation, endianness, mutation rights, API lifetimes, and security. A borrowed view must not outlive or observe mutation of its backing storage. Untrusted data still needs bounds and semantic validation. An Arc<[u8]> can simplify lifetime sharing but adds allocation, reference counting, and retention of the whole slice owner.
Choose among borrowed views, compact owned fields, copy-on-write, shared immutable buffers, and eager decoding based on access frequency and lifetime. Measure bytes copied and peak live bytes together. Reducing the first while increasing the second is not automatically a win.
Keep the unit attached to the decision
A cost investigation should end with a budget expressed at the same boundary as the production decision. Per-element cycles can explain a parser mechanism, but service capacity also includes batching, queueing, synchronization, and I/O. Bytes allocated per request can explain allocator pressure, while peak live bytes decide whether the process survives its concurrency target. Binary size may affect cold start and instruction locality, but source-level elegance is not a substitute metric.
Normalize carefully. Cost per request hides differences in record size; cost per byte hides fixed setup; throughput hides rejected work and tail latency. Retain absolute totals alongside normalized values. If an optimization reduces CPU per accepted record by discarding expensive invalid inputs earlier, record the changed security and error contract rather than calling the result semantically neutral. The experiment should make cost movement visible across the whole boundary, including work shifted to callers, background tasks, kernels, or later cleanup.
Rank three implementations before measuring
Suppose the relay can use one of these designs:
- Owned per record: clone payload and trace ID,
format!an audit line, and callwrite_allfor each record. - Shared batch: store payloads in
Arc<[u8]>, classify through&dyn Classifier, append into one batch buffer, and flush every 128 records. - Borrowed pipeline: borrow fields from a pooled receive buffer, use a generic classifier, reuse per-worker output storage, and flush on size or deadline.
Do not announce design 3 as the winner. Produce a prediction table:
| Candidate | Likely dominant cost | Likely secondary cost | Risk that can reverse ranking |
|---|---|---|---|
| Owned per record | allocation/copy and write frequency | formatting | downstream I/O dominates all CPU differences |
| Shared batch | batch flush and payload scan | refcount traffic/indirect call | fan-out causes count contention or long retention |
| Borrowed pipeline | payload scan and cache misses | pool coordination | borrowers pin buffers and create pool starvation |
Then define falsifiers. Allocation profiles can disprove the expected rate. A syscall trace can show whether write_all maps to one call or many and whether buffering changes it. CPU samples and hardware counters can reveal cache and branch pressure. A thread scaling experiment can expose refcount or false-sharing effects. End-to-end load tests can reveal that reduced local work merely moves queueing.
Use the lab to make the first comparison concrete:
cargo run --profile service -- static 2000
cargo run --profile service -- dynamic 2000
Matching checksums are a correctness prerequisite, not proof of semantic equivalence for every production effect. Add representative payloads, malformed inputs, output behavior, cancellation, and resource limits before using the result to choose architecture.
Review the cost argument
Before approving a performance-motivated Rust change, ask:
- Is the decision tied to a production metric or resource budget?
- Are events counted at deployment, process, connection, batch, request, field, and byte frequency?
- Does “move,” “copy,” or “clone” name the concrete type and bytes involved?
- Are allocation calls, allocated bytes, peak live bytes, and retained capacity distinguished?
- Does a sharing repair account for
Arcallocation, refcount operations, indirection, contention, and lifetime? - Is dispatch frequency high enough for dynamic dispatch or lost inlining to matter?
- Are iterator fusion, bounds-check elimination, devirtualization, and branch behavior observations rather than guarantees?
- Are formatting and temporary output ownership visible?
- Are syscall count, bytes per operation, flush semantics, and backpressure measured?
- Does the data layout match the fields consumed together?
- Could false sharing or a shared counter limit scaling?
- Does “zero-copy” name the eliminated boundary and account for buffer retention?
- Do alternatives preserve correctness, cancellation, errors, and maintainability?
- What observation would overturn the current ranking?
The best cost model is a disciplined suspicion. It narrows the search without pretending to have measured. Once the dominant path is identified, build settings can expose or conceal opportunities across source and crate boundaries. That is the next decision: not “turn optimization on,” but choose which artifact the compiler should produce, for which machine and operational contract.
Sources and version notes
The lab targets Rust 2024, stable Rust 1.97.0, and an explicit Rust 1.85 MSRV. Layout, code generation, cache behavior, syscall mapping, allocator behavior, and performance are target- and version-sensitive unless an official contract states otherwise. The Rust Performance Book is practical project guidance, not a language specification; reproduce its recommendations against the active workload.
- Rust standard library:
Vec - Rust standard library:
Clone - Rust standard library:
Arc - The Rust Programming Language: trait objects and dynamic dispatch
- Rust standard library:
BufWriter - Rust Performance Book: heap allocations
- Rust Performance Book: bounds checks
- Rust Performance Book: data types and layout