The Rust Engineering Handbook / Chapter 84
Measurement and Benchmark Design
Design performance experiments whose workloads, artifacts, distributions, comparisons, and thresholds can survive engineering review.
A parser change arrives with a persuasive review note: “The new loop avoids branches and is 18% faster.” The patch includes one timing from a laptop. It does not identify the production decision, input distribution, artifact profile, compiler, warmup protocol, sample count, background load, latency statistic, allocation behavior, or baseline revision. The code may be excellent. The evidence cannot yet approve it.
Performance engineering begins at this threshold. Rust makes many costs visible enough to reason about—allocation, copying, dispatch, syscalls, synchronization—but visibility is not measurement. A benchmark turns a question into observations under a declared protocol. It does not turn observations into universal truth.
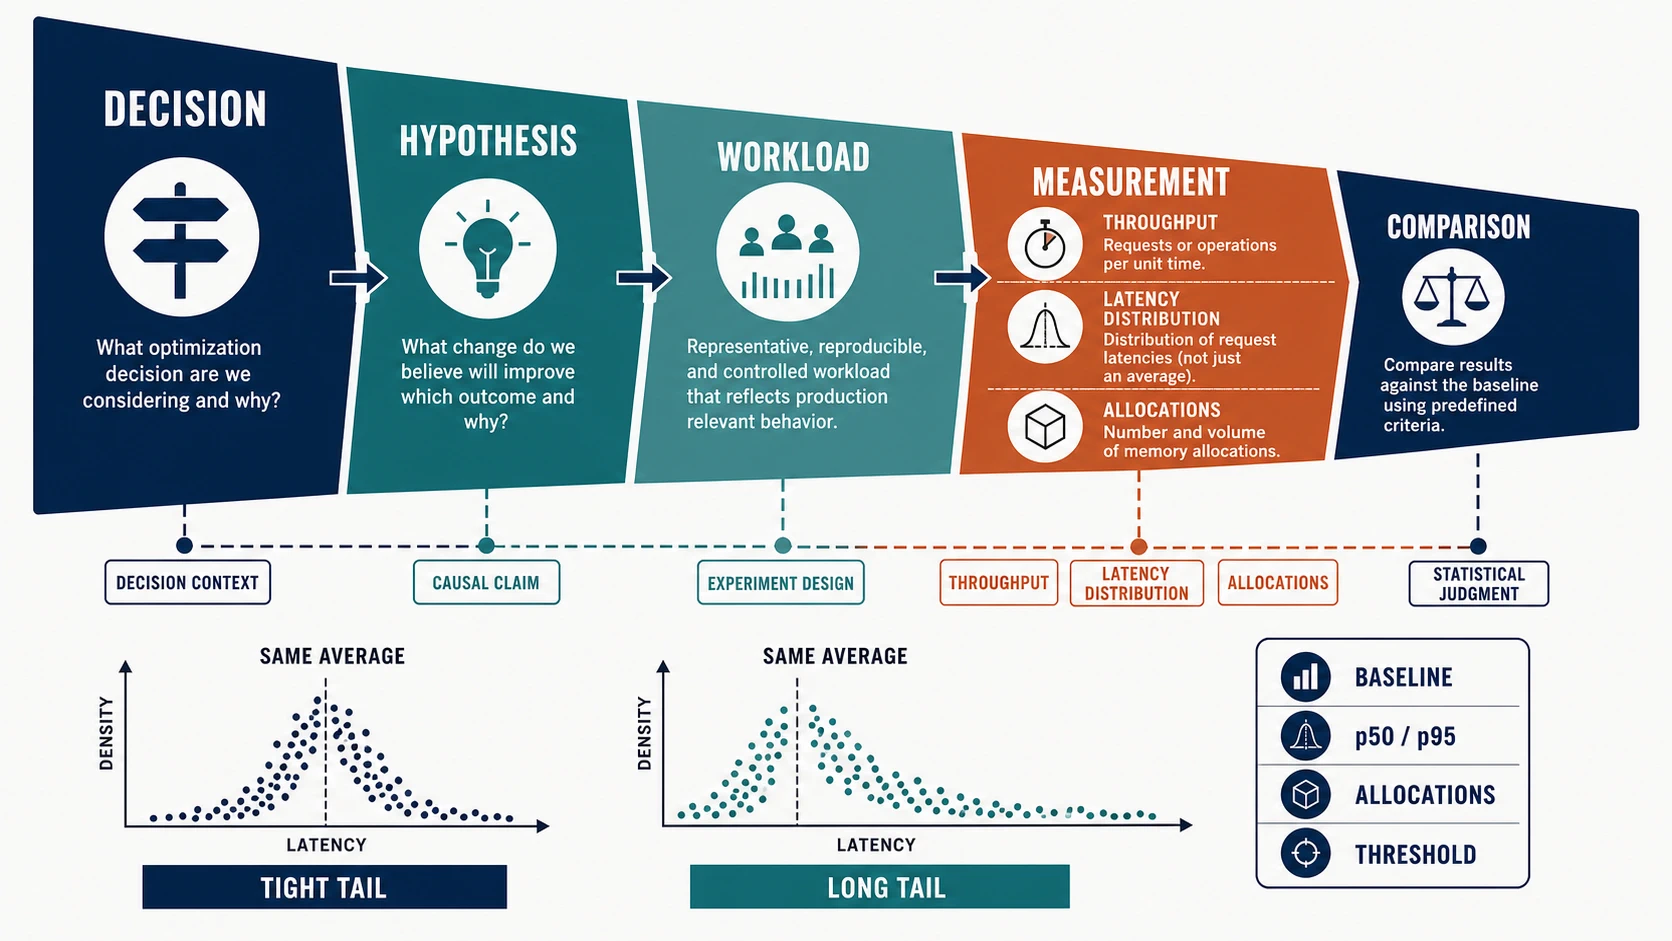
The controlling rule is: write the decision and falsifiable hypothesis first; choose a representative workload and measurement boundary; compare distributions from identifiable artifacts in a controlled environment; then apply a predeclared threshold that includes practical significance and uncertainty. An optimization is accepted because that evidence supports a decision, not because a number moved in the desired direction.
Start with the decision that will change
“Make the parser faster” is not an experiment question. It has no workload, metric, constraint, or consumer. Better questions bind measurement to an action:
For 1 KiB escaped records on the x86-64 ingestion workers, does replacing the field scanner reduce steady-state p95 parse latency by at least 8% without increasing allocations, malformed-input rejection time, binary size beyond 1%, or error-rate risk?
That question identifies a candidate, population, primary outcome, minimum useful effect, and guardrails. It can be answered “no.” A falsifiable hypothesis might be:
Because the current scanner revisits escaped bytes, a single-pass state machine will reduce executed work on escape-heavy inputs; the effect should grow with escape density and be small on ordinary short records.
The mechanism predicts a pattern across workloads, not merely a favorable aggregate. If ordinary inputs improve while escape-heavy inputs regress, the hypothesis is wrong or incomplete even when a weighted average looks green.
Before writing a harness, record:
- the decision owner and deadline;
- candidate and baseline revisions;
- target users, hardware, and deployment profile;
- primary metric and guardrails;
- minimum practically important effect;
- expected causal mechanism;
- confounders and exclusions;
- stop rule and follow-up evidence.
This short plan prevents metric shopping. Without it, engineers can try mean, median, best sample, throughput, or a convenient input until one supports the patch.
Choose micro or macro scope by the uncertainty
A microbenchmark isolates a narrow operation: parsing one record, looking up one key, cloning one value, or polling one future. It is useful for causal diagnosis because the measured region contains little unrelated work. It is also easy to make unrepresentative. Inputs stay hot in cache, setup disappears, branches become predictable, and the compiler may see more than it sees in the application.
A macrobenchmark measures an end-to-end transaction, service request, batch, startup, or replay. It captures interactions among parsing, allocation, I/O, scheduling, caches, and backpressure. Its variance and diagnostic ambiguity are higher. A change may improve parsing but disappear under network latency, or it may shift contention elsewhere.
Use them together when the decision matters:
- A microbenchmark tests the proposed mechanism and sensitivity to input shape.
- A component benchmark includes realistic buffers, ownership, and concurrency.
- A macrobenchmark checks whether the effect reaches the user-visible path and preserves guardrails.
- Profiling or counters explain why the observed movement occurred.
Do not demand end-to-end evidence for every local refactor. Do not approve a system capacity claim from a nanosecond-scale loop. Match scope to the uncertainty the decision needs to resolve.
Build a workload model before an input corpus
Representative does not mean “large” or “copied from production once.” A workload model states the dimensions that affect cost and how the experiment samples them. For the parser, relevant dimensions include:
- record length and field count;
- delimiter and escape density;
- ASCII versus multibyte data where decoding is involved;
- valid, truncated, and malformed records;
- repeated versus varied records;
- buffer alignment and chunk boundaries;
- hot versus cold data;
- batch size and concurrency;
- accepted production maxima and adversarial limits.
The chapter lab uses three named families: a typical 96-byte record, a 1 KiB escape-heavy record, and a 64 KiB large record. Those are teaching fixtures, not claims about a real service. A production plan should derive weights and ranges from telemetry, protocol limits, traces stripped of sensitive data, or a reviewed synthetic model.
Keep the corpus versioned. Record its generator and seed when generated. Validate semantic equivalence across candidates: both implementations must accept, reject, and interpret the same inputs before their speed is compared. A faster parser that skips validation has changed the contract.
Beware repetition. Reusing one buffer can create unrealistically stable branch history and cache residency. Rotating a corpus better represents varied records but adds indexing and cache effects. Choose deliberately and keep setup outside or inside the timed region according to the decision. If production includes allocation and decoding, excluding them needs an explicit reason.
Define the measurement boundary in code
The lab’s scanner returns a summary so the benchmark can consume observable work:
pub fn scan_record(input: &[u8]) -> ParseSummary {
    let mut fields = 1;
    let mut escapes = 0;
    let mut checksum = 0xcbf2_9ce4_8422_2325_u64;
    let mut escaped = false;

    for &byte in input {
        checksum ^= u64::from(byte);
        checksum = checksum.wrapping_mul(0x0000_0100_0000_01b3);
        if escaped {
            escaped = false;
        } else if byte == b'\\' {
            escaped = true;
            escapes += 1;
        } else if byte == b'|' {
            fields += 1;
        }
    }

    ParseSummary { fields, bytes: input.len(), escapes, checksum }
}
The custom stable harness creates inputs before timing, warms the candidate, executes many parser iterations per sample, black-boxes inputs and results, and summarizes 60 batched samples. Batching amortizes clock-read and loop-control overhead, but an excessively large batch can hide interruption structure and thermal drift. Measure empty-harness overhead when operations are extremely small.
The boundary has to answer four questions:
- What setup is excluded, and is it excluded in production?
- What result is consumed so useful work cannot disappear?
- What mutable state carries across iterations?
- What cleanup, allocation, or destruction happens inside the interval?
Destruction is easy to move accidentally. Timing the construction of a value while its Drop runs after the clock read excludes cleanup. That may be correct for a retained object and wrong for per-request work. Make lifetime boundaries visible.
Compile the artifact you intend to discuss
Debug and optimized Rust answer different questions. Cargo’s default development and test profiles are not suitable evidence for deployed steady-state performance. cargo bench uses the optimized bench profile by default; a custom harness can run on stable with harness = false. Record the exact command, profile, rustc verbose version, target, enabled features, code-generation units, LTO settings, target CPU flags, and relevant linker settings.
The compiler is allowed to inline, specialize, vectorize, hoist, constant-fold, and delete computations when semantics permit. Benchmarks create unusually visible constants and unused results, so optimizer effects are a design concern rather than noise.
std::hint::black_box asks the compiler to be maximally pessimistic about a value. Use it on realistic inputs and on the result when deletion is possible:
let started = Instant::now();
let summary = scan_record(black_box(input));
black_box(summary.checksum);
let elapsed = started.elapsed();
This is a best-effort hint, not an optimization firewall. Official standard-library documentation explicitly declines correctness, cryptographic, or universal code-generation guarantees. Expressions computed before entering black_box can still be folded. Inspect optimized assembly or profiles when the claim depends on a particular transformation, and compare the benchmark call path with production.
Do not disable useful optimization merely to make a microbenchmark stable. The deployed cost includes those optimizations. Conversely, a benchmark where the compiler proves the answer from constants measures a different program from one processing runtime data.
Warm up deliberately, then preserve the transient question
Warmup can stabilize instruction and data caches, page faults, dynamic linking, allocator state, branch predictors, runtime worker creation, JIT compilation in dependencies, connection pools, and CPU frequency. Rust itself is ahead-of-time compiled, but the surrounding system still has state.
Warmup policy follows the decision. For a steady-state parser throughput question, execute unmeasured batches until startup effects no longer dominate, then sample. For startup latency, cold-cache behavior, first request, allocator growth, or serverless invocation, warmup would erase the phenomenon. Measure cold and warm phases separately instead of averaging them.
Avoid “warm up for one second” as an unexplained ritual. State the expected transient, the number or stability criterion used, and whether the baseline and candidate alternate. Long candidate-first runs can confound the change with temperature or background drift. Interleave A/B samples, randomize or counterbalance order, and retain time order so drift is visible.
Warmup also changes data. A reused hash map has different capacity; a parser buffer may retain allocations; an OS page cache may eliminate reads. Reset only the state production resets. Reconstructing everything before every iteration may measure a cold path that never exists; retaining everything may hide recurring work.
Control the environment without erasing reality
Performance measurements compete with the host. CPU frequency and boost policy, thermal throttling, simultaneous multithreading, process migration, interrupts, memory pressure, NUMA placement, virtualization, power limits, kernel version, allocator configuration, and background services can move results. Record the environment before deciding which dimensions to constrain.
For a causal microbenchmark, a dedicated host, fixed power policy, CPU affinity, controlled background activity, and repeated interleaved candidates can reduce irrelevant variation. For a deployment-capacity question, pinning to an otherwise empty core may remove the contention the service must survive. Run a controlled experiment to identify the mechanism, then a representative experiment to estimate deployed impact.
Containers constrain some resources but do not create a private machine. Neighbors still share cores, caches, memory bandwidth, storage, and thermal budgets. Virtual machines add scheduler and hardware abstraction. Cloud instance names can span CPU generations. Record the actual processor, topology, quotas, and host class visible to the workload.
Avoid collecting a baseline on one machine and a candidate on another unless the design models host effects. When CI runners are heterogeneous, execute baseline and candidate back-to-back in the same job or use dedicated labeled hardware. Preserve the pairing in raw data. If a machine changes mid-run, discard the pair for a stated reason rather than trimming only the unfavorable observation.
Environmental control also includes the software graph: operating system, kernel, libc, allocator, runtime, dependencies, firmware where relevant, and compiler backend. A clean Git diff does not mean an unchanged experiment. Capture these dimensions with the result, and change one causal axis at a time when the investigation allows it.
Treat variance as information
One duration is an anecdote. Repeated samples reveal scheduler interruptions, frequency changes, cache competition, allocator behavior, background services, and workload mixture. Do not delete inconvenient samples automatically. Classify them.
Record at least:
- raw per-sample values and execution order;
- median and selected quantiles such as p95 or p99 when sample count supports them;
- a spread measure or interval estimate;
- host and process metadata;
- failures, timeouts, and censored observations;
- baseline and candidate identifiers.
The mean is useful for aggregate resource accounting and throughput under some models. It is not a latency distribution. Two systems can have the same mean while one has a narrow tail and the other has rare severe stalls. Percentiles also need context: a p99 calculated from 60 batch samples is a coarse order statistic, not precise evidence about one-in-ten-thousand requests.
Throughput and latency are linked by concurrency and queueing. Reporting requests per second without offered load, concurrency, errors, and latency can reward a system that queues more work. At saturation, a small throughput gain may accompany unacceptable tail latency. Plot throughput and latency across load levels for capacity decisions.
Compare statistically and decide practically
A statistical comparison asks whether observed differences are distinguishable from experimental variation under stated assumptions. An engineering decision also asks whether the difference is large enough to matter and whether guardrails hold.
Prefer paired or interleaved comparisons on the same host when possible. Pairing controls some host variation, but it does not remove systematic bias from order, cache sharing, or thermal state. For noisy macrobenchmarks, independent replications across hosts or runs may matter more than thousands of iterations inside one process.
Useful analysis may include:
- difference and ratio of medians or means, chosen before seeing results;
- bootstrap intervals over independent sample units;
- robust spread and time-series inspection;
- quantile comparisons for latency;
- change-point or trend inspection across revisions;
- sensitivity across workload families and hosts.
The independent sample unit matters. Two thousand iterations inside one timed batch are not two thousand independent observations; they share a process and environment. Treating each iteration as independent creates false precision. Usually the batch, process run, or host run is the resampling unit, depending on the source of variance.
Never reduce review to “p-value below 0.05.” A tiny effect can be statistically detectable and operationally irrelevant. A large effect can be important but uncertain because the experiment is underpowered. Report effect size, uncertainty, practical threshold, and guardrails together.
When results overlap the decision boundary, the correct outcome is “inconclusive under this protocol.” Increase independent evidence, reduce identified noise, or decide that the expected value does not justify further measurement. Do not reinterpret the metric after the fact.
Count allocations beside time
Latency alone cannot distinguish less work from shifted work. Allocation count and allocated bytes often explain parser, serialization, async, and collection changes. They also predict allocator contention, memory footprint, and tail behavior under load.
The lab wraps the system allocator in its benchmark executable and increments an atomic counter on allocation and reallocation before delegating with the original GlobalAlloc contract. The counter is reset immediately before each measured batch and read before sample storage resumes. This instrumentation reported zero measured allocations per scanner iteration on the verification host, consistent with the scanner’s borrowed-input, scalar-summary design.
One verification run on rustc 1.97.0 produced the following optimized observations. They demonstrate the artifact format and scaling shape; they are not acceptance thresholds and should not be compared with results from an unidentified host:
| Input family | Median ns/iteration | p95 ns/iteration | Measured allocations/iteration |
|---|---|---|---|
| typical 96 B | 45 | 52 | 0.000 |
| escape-heavy 1 KiB | 817 | 827 | 0.000 |
| large 64 KiB | 54,801 | 54,890 | 0.000 |
The next run may move these values. Reviewable evidence retains the raw output and host record rather than copying this table into a universal budget.
That observation has boundaries. It counts calls seen by the Rust global allocator in this process, not stack usage, kernel memory, allocator-internal bytes, foreign allocators, resident set size, or allocations in another process. The atomic counter also adds instrumentation cost. Run allocation and timing passes separately when the counter perturbs the timing question, and use platform profilers or allocator tools for deeper attribution.
Allocation count and volume answer different questions. Reusing one 1 MiB buffer may make one allocation while retaining significant memory. Thousands of small allocations may fragment and contend. Record count, requested bytes where instrumentation supports it, peak retained memory, and reuse policy according to the decision.
Preserve a baseline as an artifact, not a magic number
A baseline record should bind results to:
- source revision and dirty-state status;
- benchmark and corpus revision;
- rustc, LLVM, target, profile, and features;
- hardware, operating system, power policy, and isolation controls;
- command, warmup, sampling, and analysis versions;
- raw observations and summarized metrics;
- known anomalies and exclusions.
Do not copy “48 ns” into CI and expect it to survive every runner. Absolute thresholds are suitable for controlled capacity contracts or dedicated hardware. Relative thresholds compare a candidate with a colocated baseline and tolerate some host diversity, but shared regressions can affect both. Historical control bands can detect drift yet need deliberate rebaselining when hardware, toolchain, or workload changes.
Set a regression policy with two boundaries: a practical effect threshold and an uncertainty/noise threshold. For example, investigate a candidate whose paired median is at least 8% slower and whose interval excludes the accepted noise band, while never tolerating allocation growth for the zero-allocation path. The values belong to the repository and workload; 8% is not a universal Rust rule.
Guard against threshold gaming. A 7.9% regression under an 8% gate is not “free,” and several subthreshold regressions accumulate. Store trends, assign owners, and review aggregate budgets. Conversely, a volatile benchmark should not train engineers to rerun until green. Quarantine it only with an issue, evidence, owner, and deadline.
Maintain benchmarks as production code
Benchmarks decay when their workloads, APIs, and decision owners disappear. Every benchmark should state the contract it protects and the change it is sensitive to. Delete or redesign one that cannot fail meaningfully.
Maintenance includes:
- updating workload weights when production changes;
- retaining adversarial and boundary families even when rare;
- revalidating semantic equivalence and checksums;
- pinning or recording harness and analysis versions;
- detecting compiler elimination and accidental setup movement;
- tracking runtime, flakiness, and storage cost;
- rebaselining through review, never silently;
- separating stable regression gates from exploratory investigations.
Compiler upgrades deserve their own comparison. New code generation can improve or regress a workload without a source change. Test the old and new toolchain against the same source and protocol, then test the source candidate within the chosen toolchain. Otherwise source and compiler effects are confounded.
Benchmark code can also change behavior. A new checksum, allocator wrapper, logging statement, or corpus loader may alter code generation or caches. Review harness diffs with the same care as candidate diffs and version raw records with them.
Write the parser benchmark plan before optimizing
Produce a one-page experiment dossier before changing the parser:
- Decision: name the proposed change, owner, target deployment, and choice the result will govern.
- Hypothesis: state the causal mechanism and predicted pattern across ordinary, escape-heavy, large, and malformed inputs.
- Correctness gate: run the same corpus and property checks against baseline and candidate; compare accepted values and errors.
- Workload: specify lengths, field counts, escape densities, validity classes, weights, corpus provenance, and cache/repetition policy.
- Scope: choose micro, component, and macro evidence; mark setup, parsing, allocation, and destruction boundaries.
- Artifact: record revisions, clean state, Rust 2024 edition, rustc verbose version, target, features, bench profile, and code-generation settings.
- Environment: record CPU, operating system, power/frequency policy, affinity or isolation, background load, temperature strategy, and container or VM limits.
- Protocol: specify warmup, A/B order, samples, iterations per sample, timeouts, raw-output format, and rerun rule.
- Metrics: choose primary latency or throughput statistic plus tail, allocations, bytes, errors, and binary-size guardrails.
- Comparison: define independent sample unit, effect calculation, uncertainty method, minimum useful effect, regression threshold, and inconclusive region.
- Stop rule: state what approves, rejects, or triggers deeper profiling; prohibit selecting a new primary metric after results arrive.
- Maintenance: name baseline retention, trend owner, workload review date, and rebaseline procedure.
The lab is a starting artifact. Run its three input families, inspect raw CSV, and explain why the single host result cannot establish a production threshold. Then change one workload assumption—rotate a corpus, include decoding, or add malformed inputs—and predict the direction before measuring.
Review performance evidence before reviewing clever code
Use this review sequence:
- What decision changes if the result is positive, negative, or inconclusive?
- Is the hypothesis causal and falsifiable?
- Does the workload represent cost-driving dimensions rather than convenient examples?
- Do baseline and candidate preserve semantics?
- Is the measured boundary the production boundary under discussion?
- Were setup, destruction, allocation, and caching placed intentionally?
- Are optimized artifact, compiler, target, features, and profile recorded?
- Could constants or unused results let the optimizer erase work?
- Does warmup preserve or erase the phenomenon of interest?
- Are raw samples, order, variance, errors, and outliers retained?
- Are throughput, latency distribution, load, concurrency, and errors interpreted together?
- Are allocation count, bytes, and retained memory measured at adequate fidelity?
- Is the comparison unit genuinely independent?
- Are practical effect, uncertainty, and guardrails all part of the decision?
- Can another engineer reproduce the protocol and explain its limits?
Measurement discipline precedes optimization technique. The investigation rule is durable across allocations, copies, dispatch, syscalls, caches, and other likely costs: predict a mechanism, isolate it enough to learn, reconnect it to the production workload, and keep uncertainty attached to every number. The next task is to rank those mechanisms without turning the ranking into folklore.
Sources and version notes
The lab targets Rust 2024, stable Rust, and an explicit Rust 1.85 MSRV. The recorded sample run used rustc 1.97.0 on x86_64-unknown-linux-gnu; its numbers are host observations, not manuscript promises. The built-in #[bench] attribute remains nightly-only in the current Cargo documentation, while stable custom harnesses can disable the built-in harness. Re-check compiler, Cargo profile, and benchmarking-tool behavior before using a protocol as a release gate.