Performance Engineering and System Design Handbook / Chapter 52
Load, Stress, Spike, Soak, and Resilience Testing
Turn capacity and launch decisions into safe multi-phase tests that preserve representative demand, correctness, degradation, and recovery evidence.
Preparing audio…
Audio edition
Load, Stress, Spike, Soak, and Resilience Testing
Mercury API’s launch review has one question: can the service support a one-hour event expected to peak at ten times its ordinary traffic? The attached test report says yes because the system completed 6,000 requests/s for five minutes.
The result does not include the event’s read/search/write mix, four-tenant hot-key skew, client retries, durable-effect checks, or the failure of one inventory dependency. It stops at peak load and never measures how queued work drains. The generator’s attempted rate is present, but correct goodput is not. The test has produced a throughput observation; it has not answered the launch question.
Use this chapter when a launch needs a capacity gate, a system must demonstrate behavior beyond its operating knee, a burst or long-lived workload reveals different failure modes, or a resilience claim needs controlled failure and recovery evidence. You should leave able to choose a test class, compose a phase profile, preserve realistic clients and data, define correctness and abort oracles, measure time to stable SLO, and write a report that supports one explicit decision.
Start with the decision, not the load generator
A load test is a time-ordered experiment. Its claim inherits Chapter 51’s workload, boundary, environment, state, and generator obligations, then adds phases, faults, safety, correctness, and recovery. Write the decision before a script:
Decision: Whether Mercury API is ready for a one-hour event whose forecast peak is 6,000 offered operations/s, ten times the ordinary 600/s rate, while preserving reservation correctness and returning to stable SLO within eight minutes after an inventory-dependency impairment.
The system boundary begins at external test clients and ends at the durable reservation-effect ledger. The unit of useful work is one correct logical operation completed within its objective—not one HTTP attempt. Retries remain visible as attempts, and a duplicated reservation is a correctness failure even if both responses are fast.
That statement prevents three common substitutions:
- maximum attempted requests for correct goodput;
- a short steady hold for the one-hour event envelope;
- survival during fault injection for controlled recovery afterward.
The test can reject readiness without proving production will be safe. Passing increases confidence only for represented workloads, states, environments, and faults. Chapter 53 will ask how much uncertainty and confounding remain; this chapter makes the experiment complete enough for that question to be meaningful.
Test names describe different questions
Teams often use “load test” for every experiment that sends concurrent traffic. Use a taxonomy based on the decision and state transition instead:
| Test class | Primary question | Load/state shape | Essential outputs | Does not establish by itself |
|---|---|---|---|---|
| functional under load | do invariants and outcomes remain correct with concurrency? | representative traffic below known capacity | outcome reconciliation, ordering, duplicates, data state | capacity ceiling |
| capacity | what safe goodput meets declared objectives? | stepped holds through expected operating range | goodput, latency distributions, resource demand, knee | behavior far beyond the knee |
| stress | how does the system degrade or collapse beyond its intended envelope? | deliberate progression past safe capacity | rejection, failure mode, collapse point, evidence preservation | acceptable production operation there |
| spike | can admission and elasticity absorb a rapid demand step? | abrupt rise, short hold, abrupt or staged fall | queue age, drops, scale delay, tail, recovery | long-duration stability |
| soak | which slow accumulation or drift appears under sustained work? | long representative hold with ordinary background work | live set, RSS, connections, compaction, file/queue growth | sudden overload behavior |
| endurance | can the system repeatedly operate for the required mission duration? | long run with cycles, maintenance, rotation, and state changes | correctness and objective stability across cycles | response to an untested fault |
| scalability | how do goodput and efficiency change as resources or topology change? | controlled load/resource matrix | per-resource demand, speedup, coordination, cost | elasticity speed or failure safety |
| resilience | what useful service remains during impairment, and how does recovery complete? | representative load plus controlled fault and recovery | degraded goodput, invariants, time to stable SLO, backlog drain | every unknown failure mode |
These classes can share a harness, but one run should not acquire every label. A ten-minute peak hold does not become a soak because memory was graphed. A node termination with no steady workload does not establish capacity during failure. A scalability test that adds replicas but changes the data set confounds resources with workload.
The taxonomy is a planning matrix, not a maturity ranking. Select the smallest experiment that supports the decision, then add phases only when their interactions matter. Mercury needs functional-under-load, capacity, spike, soak, and resilience evidence because the launch combines concurrent writes, a sudden demand change, a one-hour duration, and a known dependency risk.
Build one profile from named operating phases
An event test should reproduce the transitions that create operational risk, not jump from idle to a headline rate. Mercury’s retained plan contains nine named phases:
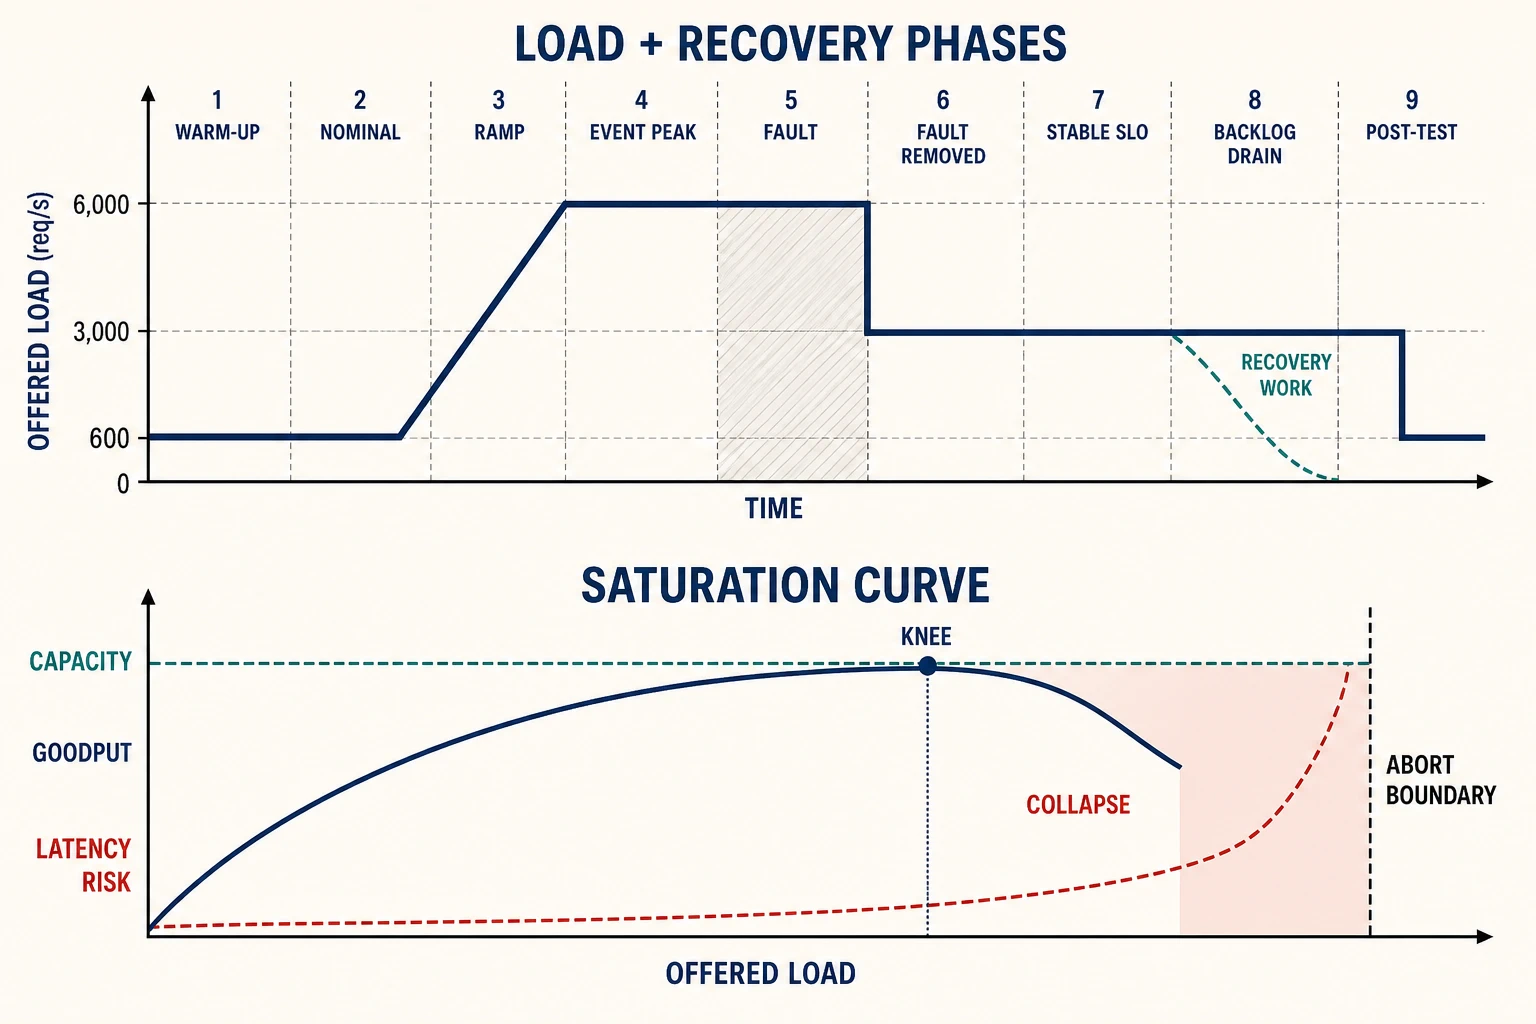
| Phase | Duration | Offered load | Evidence job |
|---|---|---|---|
| warm-up | 10 min | 600/s | establish connections, code, caches, heap, and generator stability |
| nominal hold | 15 min | 600/s | record the ordinary reference population |
| ramp | 12 min | to 4,500/s | expose the approach to nonlinear behavior without carrying hidden schedule loss |
| event peak | 20 min | 6,000/s | test launch goodput, p99, errors, skew, and invariants |
| dependency impairment | 8 min | 6,000/s | add 180 ms inventory latency while demand remains at peak |
| fault removed | 2 min | 3,000/s | observe immediate recovery, queued work, retries, and control-loop response |
| stable SLO | 4 min | 3,000/s | require consecutive compliant windows rather than one good sample |
| backlog drain | 12 min | 3,000/s foreground | drain 450 queued operations/s without starving current work |
| post-test nominal | 10 min | 600/s | compare final state with the ordinary reference |
The profile distinguishes fault removal from recovery. Removing 180 ms of dependency latency stops the treatment; it does not erase retries, cold connections, re-elections, cache loss, queued writes, or compaction. Mercury reaches its stable-SLO gate six minutes after the recovery phase begins and drains backlog in another twelve. If the report ended when the fault was removed, it would omit the system’s most capacity-sensitive work.
Hold durations must match the mechanisms under investigation. A cache can warm in minutes while a compaction cycle appears hourly. A failover can elect a leader quickly but rebuild data for hours. State the cycle each hold is intended to observe and record what did not occur during it. “Steady” means declared indicators stayed within a band for enough windows—not that a timer expired.
Representative load includes client behavior and data shape
Mercury’s event workload is 70% catalog reads, 20% recommendation searches, and 10% reservation writes. One operation count hides their different CPU, storage, fan-out, and correctness costs. The test must preserve the mix at every phase or intentionally state a different stress population.
Skew is equally causal. In the model, 4% of tenants generate 35% of traffic. Uniform tenant selection would remove hot cache entries, lock contention, per-tenant quotas, and concentrated downstream work—the mechanisms most likely to limit the event. Relevant data-state dimensions include catalog size, reservation-key popularity, cache warmth, index shape, retained history, and partition balance.
Clients are part of the workload model:
- Timeouts and abandonment: Mercury clients wait at most 900 ms; the harness must record intended arrival, actual send, timeout, and any server work that continues.
- Retries: at most two attempts per logical operation, with the real backoff and idempotency token. Attempts and logical outcomes are different populations.
- Think time: a closed interactive population may reduce demand when latency rises; an event feed may continue arriving independently. Choose from production behavior.
- Connections: reuse, establishment, TLS/session behavior, multiplexing, and pool bounds affect both client and server.
- Response consumption: validate payload and durable effects; a client that discards bodies can remove flow-control and parsing costs.
The generator must remain outside the system under test and preserve schedule at the highest phase. If it loses more than 1% of intended arrivals, Mercury’s plan stops and invalidates the phase. A saturated client can turn an open event into a closed workload and make the service appear stable precisely when it is not.
The ramp finds a knee; stress reveals the failure shape
Mercury’s separate simulated saturation sweep holds workload mix and state constant:
| Offered/s | Correct goodput/s | p99 request latency | Failed outcomes |
|---|---|---|---|
| 3,000 | 2,970 | 92 ms | 0.2% |
| 4,500 | 4,410 | 132 ms | 0.5% |
| 6,000 | 5,700 | 244 ms | 0.8% |
| 7,000 | 5,950 | 650 ms | 4.1% |
| 8,000 | 5,600 | 1,900 ms | 16.0% |
At 6,000/s, Mercury satisfies the launch gate: at least 5,400 correct completions/s, p99 no greater than 300 ms, and failed outcomes no greater than 1%. Moving from 6,000 to 7,000 offered/s gains only 250 good completions/s while p99 rises by 406 ms. At 8,000/s, correct goodput falls even as offered load rises. The collapse region is not additional capacity.
Ramp shape changes what the system experiences. A slow ramp lets autoscaling, caches, and connection pools adapt; it may be appropriate for capacity mapping. A vertical spike tests admission, prewarmed reserve, queue bounds, and scaling delay. Use both when the event can arrive quickly. Do not infer spike behavior from a slow ramp.
Stress continues beyond the safe knee only under explicit limits. Its job is to reveal whether the system rejects cheaply, degrades predictably, corrupts state, deadlocks, thrashes, or becomes unrecoverable. Stop before the experiment threatens shared dependencies or data custody. “Find the breaking point” is not authority to manufacture an outage.
Inject failure while the workload is meaningful
Faults should target a named hypothesis. Random impairment can discover surprises, but a launch gate needs causal questions such as:
- Does +180 ms dependency latency consume the request deadline and trigger retry amplification?
- Does 1% packet loss reduce goodput through retransmission or connection churn?
- Does losing one service node preserve N-minus-one capacity and tenant fairness?
- Does storage pressure increase write latency, compaction debt, or failed durable effects?
- Does leader movement preserve acknowledgment semantics and bound recovery backlog?
Only inject faults the environment can contain and observe. Define target resources, scope, duration, permissions, expected degraded state, removal method, and abort behavior. Verify that the injection actually occurred; a successful API call is not proof that the intended data path was impaired.
Fault combinations deserve restraint. Dependency latency plus node loss can test a credible correlated event, but it also makes attribution harder and blast radius larger. Establish single-fault behavior first. When combinations are essential, state the hypothesis and stop conditions for the combined state.
During Mercury’s dependency impairment, goodput falls to 4,930/s, p99 reaches 438 ms, failed outcomes reach 2.6%, and oldest queue age reaches 8.4 s. That fails the normal peak objective but may satisfy a predeclared degraded contract. The report must not silently grade the fault phase against a standard invented after seeing results.
Recovery is a state transition with its own objective
Time to stable SLO begins at a declared event—usually verified fault removal or capacity restoration—and ends only after every required indicator remains compliant for a defined number of windows. One low-latency window while errors or backlog remain high is not stable recovery.
Mercury requires:
- correct foreground goodput and request p99 within the recovery objective;
- retry and failed-outcome rates back within their bands;
- oldest queue age falling rather than oscillating;
- no duplicate durable effects or lost acknowledged writes;
- resource demand and control loops no longer escalating;
- a bounded backlog-drain projection.
The first recovery phase reduces offered load to 3,000/s so the system has headroom. After two minutes, p99 is still 356 ms and queue age 6.2 s. Four additional compliant minutes put p99 at 176 ms and queue age at 2.1 s, so time to stable SLO is six minutes. Backlog drain then uses 450 operations/s of reserved capacity and completes in twelve minutes.
This separates service restoration from recovery completion. A service can accept new work while still carrying repair, replay, cache warming, or compaction debt. Conversely, draining at maximum speed can cause a second collapse. Report foreground and recovery work separately, including the policy that prevents drain from starving current requests.
Correctness is an oracle, not an error counter
HTTP success and low latency do not prove correct behavior. Under concurrency and retries, Mercury must preserve reservation uniqueness, inventory bounds, acknowledged-write durability, and response/data agreement. The fixture reconciles:
1,800,000 logical reservation writes
= 1,800,000 durable reservation effects
+ 0 lost acknowledged writes
+ 0 duplicate durable effects
It also records 86,400 retries as attempts, not extra logical successes. This conservation check detects a harness that counts both attempts as throughput or removes timed-out operations from the result.
Choose oracles from invariants:
- unique idempotency key maps to at most one durable effect;
- an acknowledged reservation exists after failover and recovery;
- inventory never falls below its allowed bound;
- ordered events preserve the stated ordering scope;
- a read labeled fresh satisfies its freshness bound;
- derived totals reconcile with authoritative records after drain.
Some checks can run online; others require a post-phase audit. Online oracles must have an overhead budget so the checker does not become the bottleneck. Sampled validation can be valid only if the decision tolerates its detection limit. Safety-critical or financial invariants may require complete reconciliation.
Repair a throughput-only test
Start with a script that reports only attempts/s and p99 for successful responses. Add intended-arrival timestamps, logical operation IDs, attempt numbers, idempotency keys, response validation, durable-effect reconciliation, and population counts for offered, rejected, admitted, completed, failed, timed out, cancelled, and in-flight-at-end work. Then add a fault phase, verified removal time, stable-SLO windows, and a backlog-drain gate.
The repaired result can answer whether useful work remains correct through the phase profile. It still cannot claim transfer to a different mix, data set, client policy, topology, or failure.
Production-like and production tests carry different risks
A production-like environment improves control and protects users, but fidelity gaps must be listed: smaller data, different tenancy skew, missing background jobs, synthetic dependencies, clean caches, different quotas, or no real control-plane contention. “Same deployment manifest” does not mean same state or workload.
Production contains authentic topology, traffic, data distributions, and shared dependencies. It also contains real users, irreversible side effects, privacy constraints, and coupled failure domains. A production experiment needs explicit organizational authority, change review, scoped identities, observability, on-call coverage, abort automation, rollback/remediation, and a blast radius appropriate to the hypothesis.
Prefer a progression:
- deterministic fixture and component checks;
- controlled subsystem test with representative data shape;
- production-like multi-phase load and fault test;
- narrow canary, shadow, or production experiment when the remaining uncertainty justifies the risk.
Shadow traffic can duplicate downstream cost and may not preserve client feedback. Read-only canaries cannot establish write semantics. Sanitized data can erase skew. Every safer stage has transfer limits; every more realistic stage needs stronger guardrails.
Safety controls are executable test inputs
Mercury’s plan aborts when any correctness invariant fails, failed outcomes exceed 5% for two one-minute windows, p99 exceeds 2,000 ms for two windows, oldest queue age exceeds 60 s, or generator schedule loss exceeds 1%. These are not notes in a runbook. They are monitored conditions tied to stop and fault-removal actions.
A complete safety envelope names:
- authorized environment, accounts, regions, tenants, and resources;
- excluded control planes and shared dependencies;
- maximum offered load, data volume, fault scope, and duration;
- automatic stop signals independent of the impaired path where possible;
- a manual stop owner with a tested command and communication path;
- write isolation, test-data marking, cleanup, and privacy controls;
- evidence capture that survives the stop action;
- recovery capacity and a maximum acceptable recovery projection.
An abort does not make the experiment a failure. It is an observed boundary and often the correct result. Continuing after the decision is already unsafe creates no additional valid evidence.
Soak tests expose drift that short tests normalize away
Mercury’s eight-hour soak holds 3,000 offered operations/s with ordinary cache refresh, connection rotation, compaction, telemetry, and background cleanup enabled. Resident set size rises from 6,349 MiB to 7,219 MiB—108.75 MiB/hour—while post-collection managed live heap rises only 26 MiB. Open connections rise from 8,200 to 13,200, and compaction p99 rises from 42 ms to 91 ms.
That packet does not support “heap leak.” It ranks a connection/native-buffer lifecycle and compaction drift above managed retention. The next discriminating evidence is connection ownership and age, native allocation, file descriptors, buffer pools, and compaction queue state. Chapter 12’s heap/live-set distinction prevents the wrong runtime tuning response.
Soak indicators should include:
- post-reclamation live heap, total RSS, native memory, allocator slack, and swap/reclaim;
- open connections, descriptors, threads/tasks, queues, timers, listeners, and cache entries;
- compaction, checkpoint, index merge, log rotation, certificate/token refresh, and scheduled jobs;
- goodput, latency distribution, failed outcomes, retries, and correctness over time;
- slopes and change points, not only start/end snapshots.
Duration must cover the suspected clock. An eight-hour soak cannot validate a weekly credential rotation or a 24-hour retention boundary. State which cycles occurred and which were absent. Repeating a shorter scenario can test lifecycle cleanup, but it is not equivalent to one long stateful run when fragmentation or retained history accumulates.
The plan is an executable contract
Use this compact template before implementation:
| Plan field | Required content |
|---|---|
| decision and claim | exact go/no-go or design choice; required confidence |
| workload | logical unit, mix, skew, arrivals, data state, clients, growth |
| boundary/environment | generator placement, topology, quotas, versions, clocks, shared dependencies |
| objectives/invariants | phase-specific goodput, latency population, errors, correctness, recovery |
| phases | warm-up, ramp, holds, spike/stress, fault, recovery, drain, reset |
| faults | hypothesis, target, verified injection, scope, duration, removal |
| generator | calibration, schedule-loss rule, clock, raw attempt/logical-operation custody |
| observability | client and server outcomes, queues, resources, dependencies, test-controller health |
| correctness | online oracle, post-run reconciliation, side-effect and cleanup policy |
| safety | authorization, blast radius, aborts, manual owner, rollback/remediation |
| analysis | repetitions, phase exclusions, uncertainty, deviations, missing data |
| report | decision, evidence, transfer limits, residual risks, next action |
The machine-readable Mercury plan lives at examples/performance-engineering-system-design-handbook/part-06/load-resilience-plan/test-plan.json. Run its conservation and gate checks with:
node examples/performance-engineering-system-design-handbook/part-06/load-resilience-plan/run.mjs
node examples/performance-engineering-system-design-handbook/part-06/load-resilience-plan/verify.mjs
The report must make a decision legible
A report is not a gallery of dashboards. Lead with the decision and whether each predeclared gate passed. Then preserve claim, workload, boundary, environment, phases, generator calibration, raw evidence, correctness, safety events, deviations, uncertainty, and transfer limits.
Mercury’s simulated report would say:
- Peak gate: pass at 6,000 offered/s with 5,700 correct goodput/s, 244 ms p99, and 0.8% failed outcomes for the declared population.
- Impairment: normal SLO fails; degraded behavior remains bounded, but its contract requires explicit approval.
- Recovery: pass; stable SLO returns in six minutes and backlog drains in twelve, both within target.
- Correctness: pass for 1.8 million logical writes with no duplicates, lost acknowledged writes, or inventory violations in the fixture.
- Soak: fail pending diagnosis; RSS, connection count, and compaction p99 drift while managed live heap stays nearly flat.
- Recommendation: do not grant unconditional event readiness until the connection/native-memory drift is explained and the soak gate is rerun.
This conclusion resists score averaging. Four passing gates do not cancel one unresolved resource-lifecycle risk if the one-hour event can trigger it. The decision owner can accept residual risk, narrow the event plan, add isolation, or require remediation—but the evidence must remain visible.
Design drill: plan the ten-times event
Create a plan for the Mercury event with the stated 70/20/10 mix and hot-tenant skew. Include a slow capacity ramp and a sudden spike, +180 ms dependency latency, one node-loss variant, correctness oracles for reservation writes, an eight-minute stable-SLO target, a backlog-drain budget, and automatic aborts. After the first design, assume connection reuse falls from 95% to 60% for one mobile client version. Revise generator capacity, connection-establishment load, ramp shape, and safety limits rather than simply adding server replicas.
Diagnostic drill: decide from incomplete evidence
A report shows 6,200 responses/s and 210 ms p99 at peak. It omits offered load, failures, retry attempts, intended-arrival lateness, write reconciliation, queue age after the fault, and post-test state. Rank the missing facts. A strong answer withholds readiness: correct logical goodput and generator schedule come first, correctness and recovery next, then environment and transfer. It requests raw phase populations and a rerun only after the plan has fixed gates.
A load test is complete only when it states the decision it supports, exercises representative behavior, and measures degradation and recovery—not just peak throughput. Chapter 53 takes the resulting experimental units and asks whether the observed differences exceed noise and confounding; preserve raw runs, phase boundaries, and deviations so that analysis remains possible.
Sources and evidence scope
- Google SRE, “Testing for Reliability” explains system-scale testing as evidence that reduces uncertainty about changed systems and emphasizes testing operational and recovery tools.
- Google SRE, “Reliable Product Launches” treats overload behavior and load testing as launch-readiness concerns and describes the nonlinear behavior that simple capacity assumptions miss.
- Google SRE, “Addressing Cascading Failures” recommends testing capacity limits and overload failure modes and explicitly calls for correctness checks under high load for stateful systems.
- AWS Fault Injection Service stop-condition documentation provides a current implementation example of metric-based experiment stop conditions. The chapter generalizes the guardrail; it does not require that service.
- AWS Well-Architected resilience-testing guidance distinguishes expected-behavior resilience tests from controlled fault injection and documents environment and stop-condition practices for AWS workloads.
- All Mercury rates, latency values, phase results, correctness populations, recovery times, soak drift, and abort thresholds are simulated teaching evidence in
examples/performance-engineering-system-design-handbook/part-06/load-resilience-plan/and do not authorize a real experiment.