Performance Engineering and System Design Handbook / Chapter 50
Profiling Across CPU, Memory, I/O, Locks, and Distributed Traces
Choose and correlate profiles across execution, waiting, resources, and distributed critical paths without confusing sample width with user impact.
Preparing audio…
Audio edition
Profiling Across CPU, Memory, I/O, Locks, and Distributed Traces
The incident packet contains three honest views of the same release:
- the p99 user path rose to 180 ms;
- total CPU time per correct completion fell from 8.0 ms to 7.4 ms;
- the widest candidate on-CPU stack is still
parse, at 3.5 ms per completion.
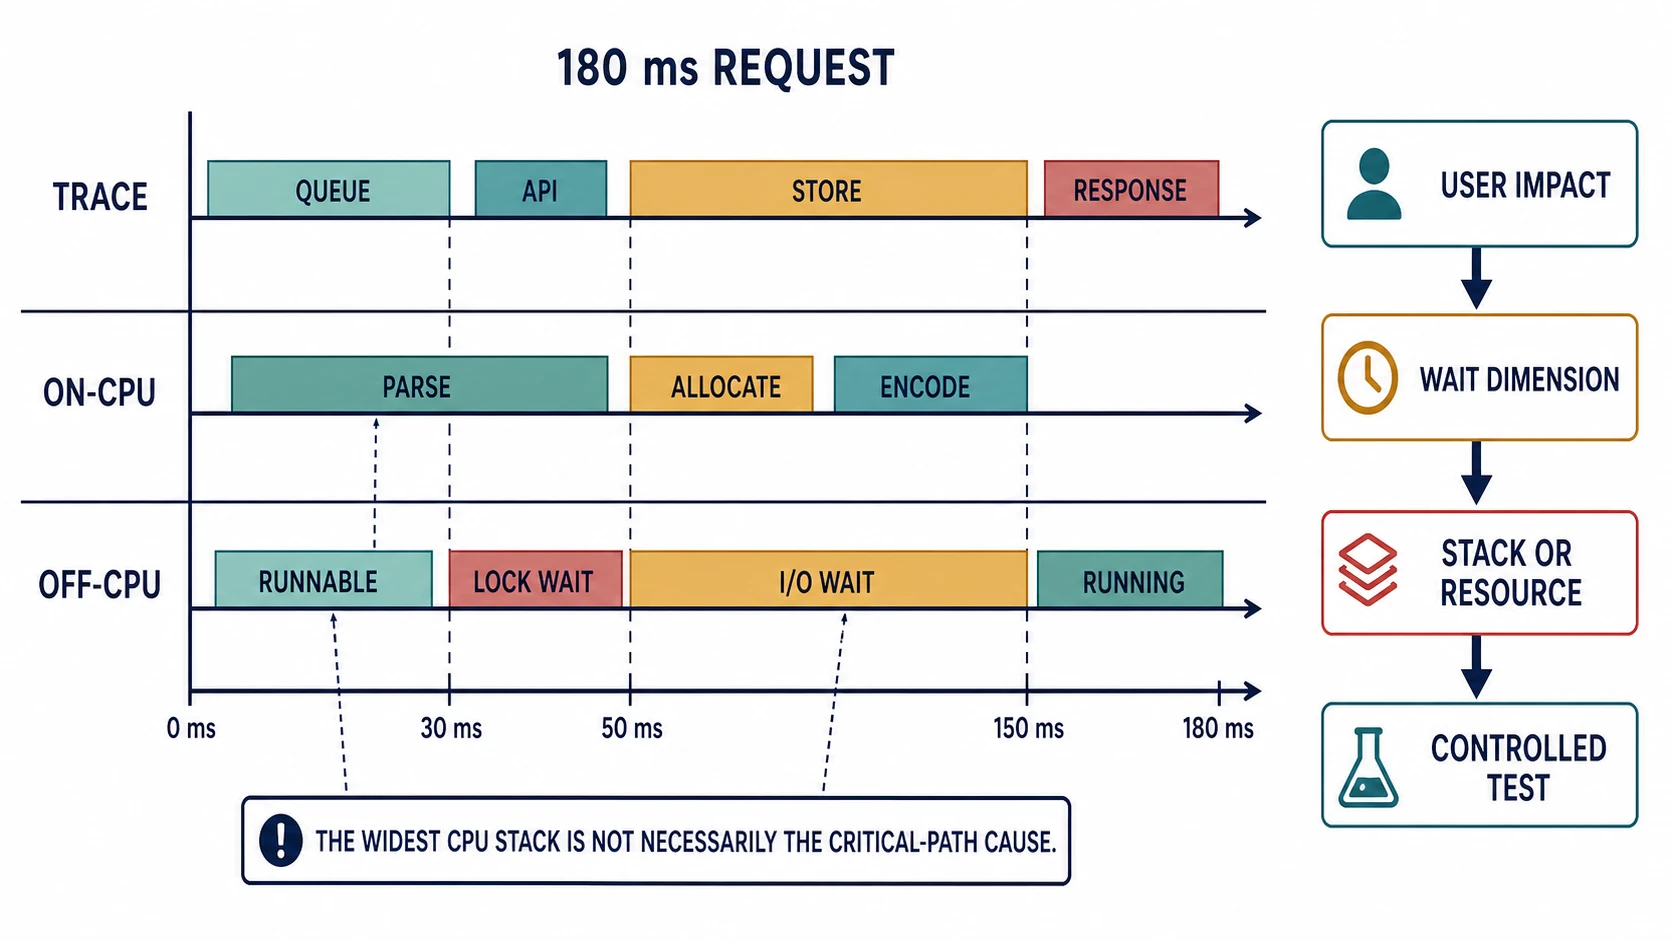
An engineer looking only at a CPU flame graph proposes optimizing parsing. The differential evidence says parsing grew by 0.3 ms, while runnable delay grew by 16 ms, lock wait by 8 ms, and I/O wait by 32 ms per correct completion. CPU work is real, but it is not the dimension in which most time was lost.
This chapter is a profiling investigation, not a tour of profiler interfaces. Use it after Chapter 49 has defined the affected population and critical path. You should leave able to select evidence for five symptom patterns, normalize two captures to equal useful work, reject biased or incomplete stacks, and turn a cross-layer correlation into a controlled causal test.
Establish the loss dimension before choosing the tool
A profile attributes a measured quantity to stacks, code, resources, or states. The quantity might be CPU samples, allocated bytes, retained bytes, blocked time, lock wait, disk latency, packets, cache-miss samples, or wall-clock time. A flame-shaped visualization does not make those quantities interchangeable.
Start with four facts:
- Population: which workload class, build, tenant class, outcome, and operating state regressed?
- Useful-work unit: correct logical completion, record, byte, batch, or another invariant output.
- Lost dimension: on-CPU execution, runnable delay, blocking, allocation/retention, device/network service, or a remote critical-path dependency.
- Decision: which change would follow if the hypothesis is true?
If the evidence cannot identify the lost dimension, collect a low-cost wall-clock or state timeline first. Do not respond by enabling every profiler simultaneously; the combined overhead and volume can erase the incident or create another one.
Sampling and instrumentation answer different questions
Sampling inspects execution or state periodically or after a configured event count. It estimates where a population spends a quantity while keeping cost bounded. It can miss rare short events, alias with periodic work, and misrepresent code the stack walker cannot see. Sample count is evidence with uncertainty, not an exact ledger.
Instrumentation records chosen entry, exit, allocation, lock, I/O, or protocol events. It can preserve exact relationships for the covered path, but probes add work to every selected event and omit everything outside their definition. High-rate probes can perturb locks, buffers, scheduling, and timing.
Use instrumentation for a narrow relationship or state transition and sampling for broad attribution. A request trace instruments selected spans; an on-CPU profile samples stacks. Correlating them is powerful only when inclusion, clocks, IDs, and missingness are understood.
Profile selection by symptom
| Symptom pattern | First profile | Add next | Common wrong turn |
|---|---|---|---|
| cores saturated; latency follows CPU demand | on-CPU samples by correct-work cohort | hardware-counter sampling for the dominant stack | tracing disk because load average is high |
| latency high while CPU remains low | wall-clock plus off-CPU/scheduler states | lock, I/O, network, or dependency-specific trace | optimizing the widest CPU frame |
| RSS grows after equal traffic | allocation profile plus retained-heap snapshots | native mappings, page faults, and ownership ages | treating allocation rate as retained memory |
| throughput collapses as workers increase | lock contention and runnable-delay timeline | coherence/NUMA and per-shard demand | replacing the hottest lock before finding its owner |
| one user path is slow across services | distributed critical-path trace | profile the service/span consuming the causal interval | summing all spans or profiling the busiest service |
The first capture narrows the question; it need not finish the diagnosis. The file-backed incident packet stores exactly these five selectors so changes to the prose cannot silently drop one.
On-CPU profiles: where scheduled execution goes
An on-CPU profile samples stacks while threads execute. It attributes CPU time or selected CPU events to paths. Use it when CPU service demand constrains latency, throughput, cost, or energy and the sampled cohort matches the affected work.
In a flame graph, the horizontal width represents the selected sample quantity accumulated for a frame and its descendants. The x-axis is a layout of stacks, not time. Vertical position is stack depth, not importance. A wide frame can be necessary, parallel, outside the critical path, or shared by many cheap operations. A narrow frame can serialize every request.
Call trees aggregate parent/child cost and support sorting by inclusive or exclusive weight. Timelines preserve when threads ran, which exposes phase changes and overlap that aggregation hides. Keep raw folded stacks or native profiler output so investigators can move among views rather than treating one rendering as evidence custody.
Hardware-counter profiles sample an event such as cycles, instructions, branches, cache-related events, or page faults and attribute occurrences to instruction pointers. Event meaning, precise-IP support, multiplexing, skid, privilege, counter availability, and processor errata constrain interpretation. Begin with Chapter 9’s broad execution model; select a model-specific event only after the dominant stall class and the CPU model are known.
Off-CPU and wall-clock profiles: where threads wait
Off-CPU time begins when a thread stops executing and ends when it runs again. The interval may include a voluntary lock or I/O wait, an involuntary preemption, scheduler run-queue delay after wakeup, paging, or ordinary idle time awaiting work. An off-CPU stack shows where the thread blocked; a wakeup stack can show who made it runnable. Without request or state filtering, worker pools mostly show their healthy idle waits.
Wall-clock profiling samples or instruments both running and waiting states. It is useful for a particular request or operation whose elapsed path matters, but parallel thread time must not be added blindly. Ten workers each waiting 100 ms represent one second of aggregate thread time inside a 100 ms wall-clock interval.
Separate at least these states:
running → preempted/runnable → running
running → lock blocked       → runnable → running
running → I/O blocked        → runnable → running
running → timer/idle wait    → runnable → running
The remedy differs: CPU capacity or affinity for runnable delay, ownership or critical-section change for lock wait, storage/network path work for I/O, and no fix at all for an idle pool. Scheduler tracing can be frequent and expensive, so filter by process, thread, cgroup, request marker, or short time window and measure drops.
Allocation and heap profiles: creation is not retention
An allocation profile attributes bytes or objects created to code. It finds churn, allocator pressure, and paths that create garbage. A heap or retained-object profile attributes live memory at a capture point and can reveal owners preventing reclamation. These answer different questions: a fast scratch allocator can create terabytes over time with a small steady heap; one rare object graph can retain gigabytes with little allocation rate.
For managed runtimes, include garbage-collection phases, JIT/compiler work, safepoints, class metadata, native allocations, thread stacks, and memory-mapped regions when they matter. “Heap is 4 GiB” is not equivalent to resident set size. For native code, allocator caches, fragmentation, mapped-but-uncommitted regions, file mappings, shared pages, and kernel buffers complicate accounting.
Normalize allocation bytes and retained bytes per useful completion and by object age. Capture before/after ownership paths around a matched workload, then confirm with process and operating-system memory evidence. A heap dump can stop or perturb a service; production policy must bound pause, size, storage, and sensitive-data exposure.
Lock profiles: waiters, holders, and the work they protect
A contention profile attributes wait duration or contended acquisitions to locks and call paths. The hottest lock by total wait may have many harmless background waiters, while a smaller lock serializes the user path. Capture holder stacks or critical-section duration when the tool supports it; waiter stacks alone name demand, not ownership.
Ask:
- which correct-work population reaches the lock;
- whether wait is on the critical path or parallel/background work;
- how wait scales with worker count and skew;
- which data invariant the lock protects;
- whether the fix reduces sharing, shortens ownership, shards state, or merely changes the primitive.
Lock-free replacement is not the default conclusion. Chapter 18 owns the mechanism design. This chapter’s job is to prove that coordination, rather than CPU, memory bandwidth, or scheduler delay, is the relevant constraint.
I/O and network profiles need both ends of the wait
An I/O profile can attribute submitted bytes, operations, queue time, device time, completion latency, retries, and errors. File-system cache hits may consume CPU without device I/O; asynchronous writeback may consume device capacity outside the request that caused dirty data. A blocked read stack proves where the caller waited, not whether the device, filesystem, network storage, or throttling policy caused it.
Preserve the chain:
request → library/runtime → syscall → kernel queue → driver/device or socket
        → completion → wakeup → runnable delay → resumed request
For network paths, add connection identity at a bounded safe scope, endpoint, direction, bytes, retransmission/loss evidence, congestion state, DNS/connect/TLS phases, and remote timing where clocks permit. Packet traces can expose contents and credentials; restrict capture, filter fields, encrypt artifacts, define retention, and prefer counters or metadata when payload is unnecessary.
System-wide kernel tracing connects application stacks to scheduler, filesystem, block, network, and memory events. It also observes other tenants and kernel activity, so privilege and data exposure are part of the capture contract. Event loss must be measured. “No event appears” is not evidence if buffers overflowed or symbols were missing.
Managed and native stacks must meet in one path
JIT compilation, inlining, optimized-away frames, frame-pointer omission, tail calls, dynamic code, separate debug files, containers, address randomization, and kernel restrictions can create partial or misleading stacks. Managed-runtime profilers may sample only at safepoints, overrepresenting code that reaches them; runtime-specific mechanisms can reduce that bias but introduce version and platform constraints.
Before interpreting shape, record:
- profiler and runtime version, kernel, architecture, and binary build ID;
- stack-walking mode and maximum depth;
- JIT/native symbol sources and symbolization success rate;
- inlining expansion policy and unresolved-frame fraction;
- sample event, interval, multiplexing, lost-event count, and capture duration;
- container/host PID and namespace mapping;
- whether kernel and native frames were available.
An [unknown] tower is a measurement failure to repair, not an application function to optimize. Compare unresolved fractions across cohorts; a changed build can appear faster simply because its expensive frames vanished from attribution.
Differential profiles require equal denominators
A differential flame graph or call tree compares weights from two captures. Color usually represents increase or decrease while width represents one chosen total or magnitude; conventions vary, so publish the legend. The visualization does not correct a mismatched experiment.
The simulated packet contains these totals:
| Quantity per correct completion | Baseline | Candidate | Difference |
|---|---|---|---|
| parse CPU | 3.2 ms | 3.5 ms | +0.3 ms |
| allocate CPU | 1.8 ms | 1.2 ms | −0.6 ms |
| encode CPU | 3.0 ms | 2.7 ms | −0.3 ms |
| total CPU | 8.0 ms | 7.4 ms | −0.6 ms |
| runnable delay | 9 ms | 25 ms | +16 ms |
| lock wait | 12 ms | 20 ms | +8 ms |
| I/O wait | 68 ms | 100 ms | +32 ms |
The baseline contains 100,000 correct completions; the candidate contains 80,000. Comparing total samples would reward the lower-output candidate. Normalize each stack or state weight by correct completions within matched endpoint, payload, tenant class, outcome, build, and operating state. Preserve total population and inclusion probability beside the normalized view.
The widest candidate CPU stack is parsing, but eliminating all 3.5 ms cannot explain a 32 ms increase in I/O wait or a 16 ms increase in runnable delay. Width ranks consumption within the selected profile; it does not rank end-to-end opportunities across dimensions.
Distributed critical-path profiling
A distributed trace reconstructs causal spans across services. A service profile attributes resource or wait within one process or host. Link them by a bounded correlation mechanism when possible: trace/span context on profile samples, request-cohort markers, or synchronized capture windows with explicit uncertainty.
The critical path is the causally necessary chain that determines completion. Do not sum parallel spans. A 200 ms background span that does not gate response is not a 200 ms user opportunity. A 20 ms serial coordinator can be more important than 400 ms of aggregate parallel worker time.
For each critical interval:
- Confirm the span boundary and missing-span rate.
- Determine whether the interval is service, queueing, runnable, lock, I/O, network, or remote dependency time.
- Select the matching local profile for that service and cohort.
- Check retries, cancellation, abandoned work, and asynchronous descendants.
- Form a change that should move both the local attribution and the end-to-end objective.
OpenTelemetry’s profile signal can link samples to trace and span context, but its specification status and implementation support must be checked for the deployed version. Correlation capability does not make biased sampling representative.
Production capture is an experiment with a blast radius
Every capture needs a runbook, even when the command is familiar.
| Runbook field | Required content |
|---|---|
| question and stop condition | hypothesis, decisive observation, maximum duration |
| target | service/build/cohort, PIDs/cgroup/host, critical-path boundary |
| mode | event, sampling frequency, stack mode, instrumentation points |
| overhead budget | CPU, allocation, pause, buffer memory, I/O, network, artifact size |
| safety | canary scope, rate limit, abort threshold, kill switch |
| evidence quality | symbols, clocks, sample/drop counts, inclusion policy, unresolved frames |
| security | privileges, payload/PII exposure, access, encryption, retention/deletion |
| comparison | matched baseline, useful-work denominator, operating state |
| custody | raw artifact, command/config, versions, hashes, analyst notes |
Measure overhead with capture off and on under intended and overload states. Prefer short, targeted captures and staged sampling-rate increases. Verify that profiler buffers are bounded and dropping rather than blocking the request path. If the capture moves the objective by the size of the suspected regression, the result is inconclusive.
Avoid synchronized fleet-wide profiling unless the question requires it and capacity has been modeled. Randomize or stagger continuous profiling so profiler work does not become a periodic load spike. Preserve a low-cost baseline long enough to compare deploys, but collect sensitive, high-resolution artifacts only for the shortest forensic need.
A capture sequence should narrow cost as it increases detail
For the 180 ms Mercury cohort, the team uses four bounded captures rather than one maximal session.
Pass 1: confirm the population. Metrics and traces isolate correct interactive lookups on candidate build 412 in one region. The trace shows the store interval and post-wakeup response path grew; request mix and offered load are matched. This pass prevents profiles from mixing batch traffic, retries, and rejected work.
Pass 2: classify thread states. A short wall-clock/scheduler capture on one canary separates running, runnable, lock-blocked, and I/O-blocked intervals. It shows that CPU execution did not grow while I/O and runnable delay did. The team stops collecting allocation evidence because neither resident memory nor allocation per completion changed.
Pass 3: attribute the dominant waits. Filtered I/O and lock captures preserve caller and, for contention, holder context. Symbols, event loss, buffer fill, and overhead stay inside the runbook bounds. The I/O stack points to the candidate store-access path; the lock stack appears mainly after clustered completions, consistent with a wakeup burst rather than a newly long critical section.
Pass 4: test one change. A matched canary restores the prior store-access pattern. The team expects I/O wait, runnable burst, lock handoff, and p99 to fall together. It retains the candidate parser, so any result cannot be credited to the widest CPU stack.
This funnel has a stopping rule after every pass. If the trace had shown queueing before the process, process profiling would have stopped. If state classification had shown on-CPU growth, I/O tracing would not have run. If symbol loss exceeded the declared threshold, attribution would have paused until the capture was repaired. Narrowing is both an inference discipline and an overhead control.
Failure, overload, and recovery change profile meaning
A nominal profile can become false guidance in other operating states. Under overload, admitted and rejected populations diverge; sampling all attempts may make cheap rejection code look dominant while correct goodput collapses elsewhere. During partial failure, retries multiply stacks and I/O, so normalize by logical operations and correct outcomes as well as attempts. During recovery, compaction, cache fill, re-replication, or backlog drain may be intentionally expensive background work that still steals foreground capacity.
Capture state labels and compare within them:
| State | Required separation |
|---|---|
| nominal | stable request mix, correct completions, ordinary background work |
| skewed | hot tenant/key/partition versus remainder |
| overloaded | offered, admitted, rejected, abandoned, and correct populations |
| failed | dependency error/timeout/retry path and degraded correctness semantics |
| recovering | foreground work versus rebuild, replay, warm-up, and drain work |
The same stack can change meaning. A checksum routine is useful foreground work in nominal service, repeated waste on a doomed retry path, and necessary verification during recovery. Profiles do not carry that semantic distinction automatically; Chapter 49’s population contract and trace relations must supply it.
Mixed-version rollouts add another boundary. Symbol maps, JIT code, inline decisions, and stack shape can differ between builds even when source names match. Store build IDs and raw addresses, symbolize with the matching artifacts, and never subtract profiles whose unresolved or inclusion fractions differ materially. A differential view is only as comparable as its capture and symbolization pipelines.
From correlation to a causal test
Use one chain of reasoning:
user impact
  → affected critical-path interval
  → lost dimension and attributed stack/resource
  → mechanism that predicts the evidence
  → controlled change
  → local and end-to-end outcomes that must move together
For the simulated Mercury incident, the working hypothesis is: the release changed store access so each lookup waits for more I/O; the additional blocking creates synchronized wakeups, raising runnable delay and lock handoff time. The predicted test is not “optimize parse.” It is to restore the store access pattern for a matched canary while holding request mix and placement constant. If I/O wait per correct completion, runnable delay, and p99 all fall together without a correctness or goodput regression, the hypothesis gains support. If only CPU parse time moves, it is rejected as the incident cause.
Run the packet checks:
node examples/performance-engineering-system-design-handbook/part-06/cross-layer-profiler/analyze.mjs
node examples/performance-engineering-system-design-handbook/part-06/cross-layer-profiler/verify.mjs
Then complete three exercises. Select the first and second profile for each of the five symptom rows without naming a vendor tool. Explain the differential packet to an incident lead in four sentences, including why the widest stack loses priority. Finally, specify a production capture for the lock-wait hypothesis with a duration, target cohort, overhead abort condition, useful-work denominator, raw artifacts, and one outcome that falsifies the claim.
The decision rule is strict: profile the dimension in which time or resources are plausibly lost, and compare captures on equal units of useful work. A profile ranks attribution inside its own measured quantity; only critical-path correlation and a controlled result can rank the optimization for users. Chapter 51 turns that controlled result into a benchmark claim with an explicit workload, boundary, environment, state, and transfer limit.
Sources and evidence scope
- The Linux
perf(1)manual describes the performance-analysis framework for hardware events, software counters, and tracepoints; exact events and access depend on the kernel and processor. - Linux perf security documentation defines access and data-exposure considerations for performance monitoring.
- async-profiler project documentation documents runtime-specific CPU, allocation, native-memory, lock, and counter modes, plus its safepoint-bias goal. Support and behavior are version-specific.
- Brendan Gregg’s Off-CPU Flame Graphs defines off-CPU stack attribution and its filtering/overhead caveats; it is a methodology source, not a deployment command for every kernel.
- OpenTelemetry Profiles specification defines profile samples, resource context, and optional span links. The signal is alpha as checked in July 2026, so implementations and schemas may change.
- All 180 ms timeline, cohort, CPU, runnable, lock, and I/O values are simulated teaching evidence in
examples/performance-engineering-system-design-handbook/part-06/cross-layer-profiler/, not production observations.