Performance Engineering and System Design Handbook / Chapter 49
Observability as a Performance Instrument
Design telemetry from operational questions so work, waiting, saturation, causal paths, and user outcomes remain distinguishable at bounded cost.
Preparing audio…
Audio edition
Observability as a Performance Instrument
At 09:42, Mercury’s host dashboard is green: CPU averages 43%, mean request latency is 38 ms, and errors remain below 0.2%. Which customers are waiting, where, and for work that will still matter when it finishes?
The dashboard cannot answer. It measures hosts and completed responses while omitting offered load, queue age, abandoned requests, tenant class, end-user time, and asynchronous work. Adding more panels will not repair an undefined question.
Observability becomes a performance instrument when every signal exists to discriminate between hypotheses. Did demand change or did the system change? Is time service, waiting, dependency, scheduling, retry, or post-abandon work? Did correct goodput fall while attempt throughput rose? The design begins with the decision an operator or architect must make, then chooses signals, dimensions, retention, and cost.
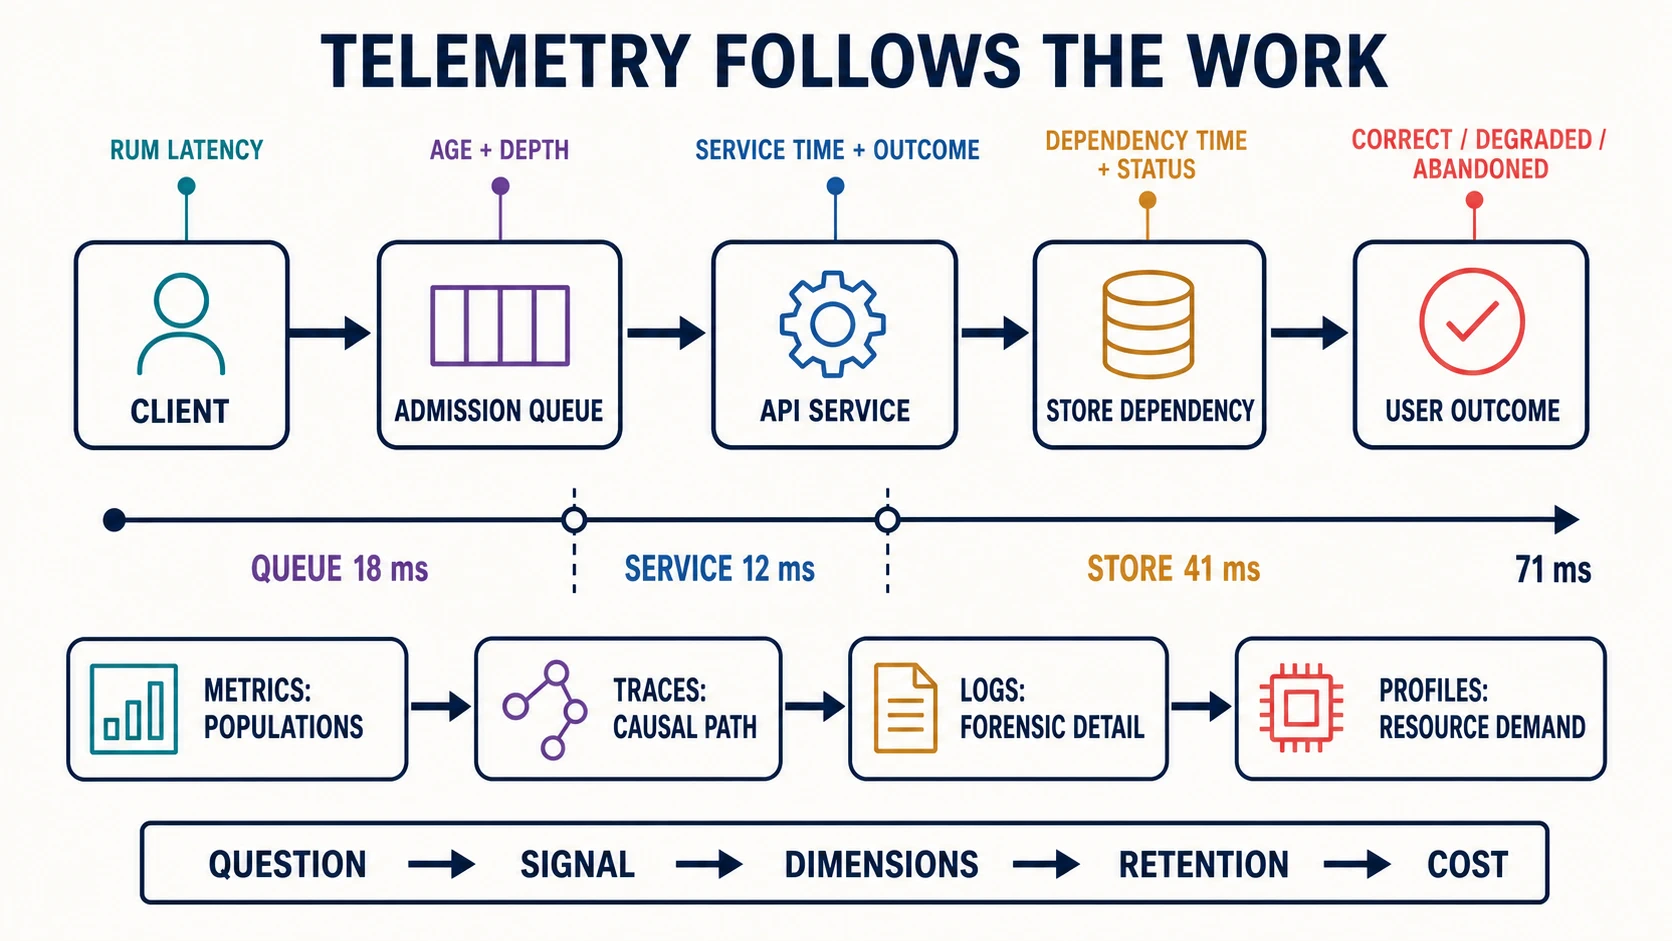
Start with questions that force a distinction
Write the question in a form whose answers imply different actions:
- Did p99 rise because request mix shifted toward expensive work, or because service demand rose within the same class?
- Are users slow before admission, while queued, in service, at a dependency, or after the server reports completion?
- Is overload reducing admitted work deliberately, or accepting work that expires unseen?
- Is one tenant consuming disproportionate offered load, queue time, or resource demand?
- Did a deploy change latency, correctness, retry amplification, or telemetry itself?
“How healthy is the service?” is too broad. “For interactive search in region A, did correct completions per admitted request fall after build 412 while offered load and tenant mix remained stable?” names population, state, dimensions, and comparison.
Create a question ledger before an instrumentation backlog:
| Question | Earliest decisive signal | Required dimensions | Action if true | Retention need |
|---|---|---|---|---|
| is admission protecting latency? | offered/admitted/rejected plus queue-age distribution | class, region, reason | tune or preserve admission | weeks for traffic cycles |
| did code increase CPU demand? | cycles or CPU-time per correct completion | build, endpoint, class | profile matched cohorts | deployment window plus baseline |
| is one dependency on the critical path? | span duration and parent/child timing | dependency, status, region | isolate, cache, or budget | traces around change/incident |
| are clients abandoning work? | client deadline plus server completion/cancel | endpoint, client class, outcome | propagate cancellation | incident and rollout horizon |
If no plausible decision changes, do not collect the signal.
Give each telemetry family one evidence job
Metrics compress repeated observations into counters, gauges, and distributions. They are efficient for populations, rates, objectives, saturation, and long comparisons, but aggregation removes individual causal paths.
Traces preserve relationships and timing for selected operations. They reconstruct a request critical path and can link producer/consumer work, but sampling and missing context can bias what survives.
Logs retain discrete forensic facts: a policy decision, version conflict, rejection reason, or corruption check. They are poor substitutes for high-rate counters and dangerous places for secrets or unbounded identifiers.
Profiles attribute CPU, allocation, lock, I/O, or other resource demand to code and stacks. They explain resource consumption, not automatically user impact.
Events represent meaningful transitions such as admission, cancellation, failover, deploy, or queue eviction. They become useful when their schema and population are stable.
Exemplars connect an aggregate observation, such as a latency histogram bucket, to a representative trace or context. They provide a route from “the tail moved” to a concrete causal path without attaching trace IDs as metric labels.
Correlation is not proof. A trace with a slow store span makes a hypothesis inspectable; a matched experiment or repeated evidence establishes whether changing the store fixes the objective.
Measure populations before ratios
The four golden signals—latency, traffic, errors, and saturation—remain useful, but a performance design needs the work populations beneath them:
offered
├── rejected before admission
└── admitted
    ├── cancelled or expired while queued
    └── started
        ├── abandoned while executing
        ├── failed
        ├── degraded
        └── completed correct
Record queue age as a distribution, not only depth. Depth needs arrival and service context; age directly reveals policy violation. Record retry attempts separately from logical operations. Record resource saturation alongside demand per useful work: CPU-time/correct result, store operations/correct result, bytes/correct result, and connection-ms/completion.
Per-tenant evidence should usually use bounded classes, quotas, or top-k investigative views rather than permanent tenant-ID metric labels. Global success can hide one tenant’s failure; unbounded identity can destroy the telemetry system. Preserve a privacy-reviewed, access-controlled route from a trace or log to an incident-specific tenant when necessary.
Preserve distributions, then aggregate lawfully
An average cannot reveal a bimodal service, a long queue tail, or the fraction beyond an objective. Histograms retain bucket counts so compatible populations can be aggregated and queried later. Choose boundaries around decisions: objective thresholds, timeout policies, queue-age limits, and expected orders of magnitude.
Do not average p99 across hosts or five-minute windows. Percentiles are properties of distributions; merge compatible histograms or raw observations first, then calculate the percentile. A precomputed client-side summary may be accurate for its own window but cannot generally be reaggregated into a fleet percentile.
Always preserve count and, where semantically safe, sum beside a distribution. A percentile from ten observations and one from ten million do not carry the same operational weight. Record missingness: absent telemetry can mean zero work, a dead exporter, a dropped series, or a query mismatch. Export pipeline health—accepted, dropped, queued, retried, and delayed telemetry—as first-class signals.
One request, three kinds of time
The simulated trace is deliberately small:
trace mercury-search/a                                      total 71 ms
client ├─────────────────────────────────────────────────────────┤
queue  ├────────────── 18 ms ──────────────┤
api                                     ├──── 12 ms ────┤
store                                        ├──────── 41 ms ────────┤
The displayed intervals overlap conceptually with ownership boundaries, so do not sum arbitrary sibling spans. A critical path is the longest causally necessary chain to the outcome, not the sum of all span durations. Parallel dependency spans can consume 80 ms of aggregate service inside a 45 ms wall-clock interval.
Propagate W3C trace context across synchronous calls. For messaging and asynchronous work, parent/child is sometimes false: one consumer batch may result from many producers, or a long-running job may outlive the initiating request. OpenTelemetry span links can express those causal relationships. Also record queue enqueue/dequeue time, message identity at a bounded privacy-safe level, attempt, and logical-operation identity so retries do not masquerade as new work.
Context propagation is an interface contract. Mixed versions, third-party boundaries, fan-out, and sampling decisions can break a trace. Instrument the break: count spans missing expected parents or links, and never infer zero dependency time from missing spans.
Cardinality is a capacity model
Every unique metric label set creates a time series. Treat dimensions as multiplicative resource demand before deployment.
The Mercury classic-histogram teaching budget has six endpoints, five outcomes, three regions, and four tenant classes: 6 × 5 × 3 × 4 = 360 label combinations. With twelve buckets plus sum and count, it creates 360 × 14 = 5,040 series, below the local 6,000-series allocation.
| Dimension | Values | Keep? | Reason |
|---|---|---|---|
| endpoint template | 6 | yes | bounded reader and owner decision |
| outcome | 5 | yes | correctness and failure populations |
| region | 3 | yes | placement and dependency boundary |
| tenant class | 4 | yes | bounded fairness and workload distinction |
| raw route/path | unbounded | no | embeds IDs and explodes series |
| tenant ID | 20,000+ | no | 100,800,000 modeled series with this histogram |
| trace ID | unbounded | exemplar only | correlation belongs outside labels |
Budget ingestion bytes, active series, query fan-out, retention, and recording rules—not just series count. Review the budget when endpoints, regions, buckets, or label values change. A semantic convention standardizes meaning; it does not grant a dimension unlimited cardinality.
Sampling changes the question you can answer
Metrics are aggregated; traces and profiles are commonly sampled. Probability sampling supports population estimates only when inclusion probabilities are known and the sample process remains representative. Head sampling decides early and controls cost efficiently but cannot know the final latency or downstream error. Tail sampling can retain slow or failed traces after seeing more of the path, but requires a stateful buffer and creates its own capacity, delay, and failure modes.
Keep a probability sample of ordinary traffic even if all errors and slow traces are retained. Otherwise investigators can compare failures only with other failures. Record sampling policy, effective rate, drops, and changes. Low-volume tenants and rare operation classes may need stratified floors. Never claim “no traces show it” when the sampler would likely discard it.
Client truth and server truth differ
Server latency begins too late to include DNS, connection setup, edge waiting, last-mile loss, UI scheduling, or rendering. It can also end before the user sees stable content. Real-user measurement (RUM) should capture a privacy-safe user outcome and navigation state, not merely browser API timing.
Connect client and server with a bounded correlation mechanism and compatible clocks, while assuming clock skew exists. Use relative span durations for within-process timing and explicit synchronization/error bounds for cross-device timestamps. Separate network failure, user cancellation, app backgrounding, and server completion.
For long-lived or offline clients, version, device class, network class, and rollout cohort matter; exact device identity usually does not belong in metrics. Sampling must account for clients least likely to upload telemetry: missingness can correlate with the worst network and crash outcomes.
Derived metrics can manufacture confidence
A dashboard ratio hides its source populations. Define every derived metric with numerator, denominator, exclusion, window, aggregation order, and missing-data behavior.
“Success rate” might mean correct completions/offered operations, successful HTTP responses/admitted attempts, or completed requests/started work. These answer different questions under rejection and retry. “CPU per request” must say whether request means attempt, admitted request, or correct logical completion.
Aggregation bias appears when traffic mix changes. If a cheap endpoint grows, fleet-average latency can improve while every endpoint regresses. Compare within workload strata and then show the mix. Per-tenant and per-class indicators reveal fairness; work-normalized indicators reveal efficiency.
Observe the observer
Instrumentation consumes CPU, memory, allocation, locks, network, storage, and operator attention. Synchronous log export can extend the critical path. High-cardinality aggregation retains memory. Tail sampling buffers traces. Fine profiles perturb scheduling. Telemetry backpressure can either drop evidence or overload the service it explains.
Set an overhead contract:
- maximum CPU and allocation per operation under nominal and overload states;
- bounded local queues and explicit drop priority;
- no blocking network export on the request path;
- sampling and aggregation limits;
- sensitive-field allowlist and redaction tests;
- exporter delay, queue fill, drops, and backend rejection signals;
- a kill switch that preserves minimum objective and overload telemetry.
Measure with instrumentation off, at intended policy, and under exporter failure. If enabling telemetry changes p99 more than the effect under investigation, the experiment is inconclusive.
Separate operating dashboards from investigation workbenches
An operating dashboard answers “must someone act now?” Use objectives and error-budget burn, offered/admitted/correct populations, queue age, saturation, change markers, and a few causal entry points. Keep panels stable enough for shared incident language.
An investigation workbench supports slicing, traces, profiles, exemplars, deploy comparison, and temporary high-resolution queries. It can be dense and hypothesis-specific. Do not page from an exploratory panel whose semantics change weekly.
Replace the host-average Mercury dashboard with:
- correct and degraded completions per offered logical operation;
- end-user and server latency histograms by bounded workload class;
- offered, admitted, rejected, cancelled, abandoned, retried, and completed rates;
- queue-age distribution and oldest admitted work;
- CPU-time, store calls, and bytes per correct completion;
- objective burn by short and long windows;
- deploy/configuration annotations and telemetry-pipeline health;
- exemplars into slow/error traces and links into matching profiles.
Host CPU still belongs in the investigation path and saturation view. It no longer impersonates user health.
Retention follows forensic half-life
Retain objective aggregates long enough for traffic cycles, capacity trends, and error-budget windows. Retain high-resolution metrics across the fastest incident and rollout decisions. Retain representative traces long enough to compare a deploy and investigate delayed reports. Retain audit-worthy events according to security, privacy, and legal policy—not curiosity.
Downsample deliberately. Preserve counts and distribution semantics; do not turn old histograms into averages. Freeze incident evidence before normal expiry when policy permits. Record schema and sampling versions so six-month comparisons do not combine different instruments silently.
Instrumentation is a versioned contract
For each signal define name, unit, instrument type, population, start/end boundary, attributes, allowed values, aggregation, missingness, privacy class, owner, stability, and change process. Adopt current semantic conventions where they fit, pin the version in the evidence record, and migrate incompatible names with dual-read or explicit cutover.
The contract for queue age, for example, must say whether age begins at edge receipt or local enqueue, whether rejected work is observed, which clock measures it, and whether observations occur at dequeue, rejection, cancellation, or periodically. A metric named queue_latency without that contract cannot support a decision.
Alert on user objectives and impending loss of control
Page on symptoms requiring timely human action: objective burn across paired short and long windows, sustained queue-age policy violations, exhaustion of an admission or resource bound, or a correctness failure. Use change markers to accelerate diagnosis, not as proof that the change caused the symptom.
Saturation alerts should lead the objective when the resource has a measured causal relation and enough intervention time. A CPU threshold copied across services creates noise. Queue age above the deadline is already lost work; alert earlier on a validated control boundary while keeping the user-impact alert authoritative.
Every alert needs owner, urgency, named population, runbook entry, and a test. Test no-traffic, missing-telemetry, exporter-failure, deploy, overload, partial-failure, and recovery states. Alerting on a derived rate without checking denominator presence is a classic way to page on instrumentation failure.
Applied endpoint: expose abandoned work
The dependency-free fixture instruments a deterministic reference endpoint. It emits separate offered, admitted, rejected, queue-wait, dependency, completed, abandoned, and post-abandon-work records. One request completes correctly in 71 ms. A second client abandons at 60 ms while the server continues to 72 ms, exposing 12 ms of post-abandon work. A third is rejected at capacity.
Run:
node examples/performance-engineering-system-design-handbook/part-06/observability-instrument/verify.mjs
Then make cancellation propagate at 60 ms. State which counters change, whether completed-but-unobserved work counts toward useful goodput, and which trace relation proves the cancellation reached the dependency. Add no label until you can name the decision it enables and its maximum value count.
Observability design checklist
- Name the operational or design question and competing hypotheses.
- Define useful work, populations, objective boundary, and five operating states.
- Place signals on client, queue, service, dependency, background, and user-outcome paths.
- Preserve offered, admitted, rejected, cancelled, abandoned, degraded, failed, and correct work.
- Use distributions with decision-relevant boundaries; never average percentiles.
- Normalize resource demand to correct useful output and stratify changing workload mix.
- Define trace propagation, async links, sampling probabilities, and missing-context behavior.
- Calculate cardinality and ingestion before adding dimensions; prohibit unbounded metric labels.
- Bound telemetry overhead, queues, drops, privacy, and exporter failure behavior.
- Separate stable operating views from investigative views.
- Define retention, downsampling, schema version, ownership, and forensic freeze.
- Test alerts against user objectives, burn, saturation, change, missingness, and recovery.
The decision rule is strict: collect telemetry only when it answers a named operational or design question, and preserve enough dimensions to separate workload change from system change. Chapter 50 turns those questions into profile selection across CPU, memory, I/O, locks, and distributed critical paths.
Sources and evidence scope
- W3C Trace Context Recommendation defines interoperable trace-context propagation. It does not guarantee complete traces or causal interpretation across asynchronous work.
- OpenTelemetry specification 1.59.0 and Semantic Conventions 1.43.0 provide current signal and naming contracts as checked in July 2026; stability levels vary by convention.
- OpenTelemetry trace API specifies span links; metrics data model defines histograms, exemplars, temporality, missing values, and reaggregation semantics.
- Prometheus histogram guidance explains aggregatable histograms versus client-calculated summaries; metric naming guidance documents label cardinality risk.
- Google SRE, Monitoring Distributed Systems supplies the golden-signal operating frame; thresholds and implementation details remain system-specific.
- The 71 ms trace, populations, and 5,040/100,800,000 series calculations are simulated teaching evidence in
examples/performance-engineering-system-design-handbook/part-06/observability-instrument/, not production observations.