Performance Engineering and System Design Handbook / Chapter 3
Objectives, Indicators, and Budgets
Define user-centered objectives and allocate revisable latency, resource, and error budgets without rewarding local optimization.
Preparing audio…
Audio edition
Objectives, Indicators, and Budgets
Seven allocations add neatly to 250 milliseconds. The arithmetic passes. Yet a customer can still wait two seconds, receive a duplicate transfer, or see a fast rejection while every component reports “within budget.” A latency budget becomes useful only after the team defines the outcome, population, boundary, workload state, and consequence that the total is meant to protect.
Objectives turn a demand model into a control system. They state which behavior matters; indicators observe it; budgets allocate uncertainty and scarce resources; operating policy decides what happens when evidence diverges. The primary decision is not “what should each service’s p99 be?” It is which end-to-end outcomes must remain within what bounds for which workload populations, and how should local constraints be revised when they fail to produce that result?
Four terms, four kinds of authority
A service-level indicator (SLI) is a quantitative measure with a defined event boundary and population: for example, the fraction of correct Ledgerline transfers whose client-submit-to-durable-acceptance time is at most 250 ms in region A over a rolling 28-day window.
A service-level objective (SLO) is a target or range for an SLI. An SLO is an engineering and product control: it should change prioritization or risk decisions.
A contractual obligation adds external consequences and legal or commercial interpretation. It may use definitions unlike the internal SLO. Do not casually label an internal target an SLA, and do not assume an SLO dashboard proves compliance with a contract.
An internal engineering target is a tighter or more diagnostic threshold used to preserve margin. It can be changed through engineering governance, but it must not silently redefine the user population or contractual measurement.
Google’s SRE guidance uses the same SLI/SLO/SLA distinction and recommends beginning with user-valued behavior rather than whatever is easiest to measure. Treat that as a durable design principle, not a universal target-setting formula.
An objective is a complete measurement sentence
“p99 latency below 250 ms” omits most of the measurement. Complete it:
At least 99% of interactive transfer attempts initiated by supported clients in region A, measured from client submission until a correct durable acceptance or explicit rejection, complete within 250 ms in rolling 28-day windows under the approved nominal workload envelope; publish separate distributions for accepted, rejected, timed-out, and unknown outcomes.
Now reviewers can challenge the start event, end event, success definition, exclusions, region, operation, traffic class, interval, load state, and target. A percentile without these terms is not portable. p99(request latency, accepted interactive transfers, region A, rolling 28 days) is different from server-side p99 for successful RPCs in a five-minute bucket.
Do not average percentiles across hosts or intervals as though they were additive measurements. A global percentile requires mergeable histograms or underlying observations with compatible boundaries and buckets. Otherwise label the aggregation as an approximation and state its bias. OpenTelemetry’s current HTTP semantic conventions express request duration in seconds and define stable metric names and attributes; adopting a common convention improves interoperability, but instrument placement still determines what the duration includes.
Latency objectives should normally separate operations, user or priority classes, geography when paths differ, and outcomes. Avoid segmentation that merely drops difficult traffic. A slow failure is user-visible behavior. If a security check, retry, or dependency is required for correctness, it belongs inside the journey boundary even when another team owns it.
Performance has more than a latency objective
Choose the few indicators needed to protect useful outcomes:
- Throughput counts completed work per unit time; pair it with the workload envelope and correctness.
- Goodput counts correct, useful outcomes. If 600 attempts/s yield 398 durable outcomes/s, advertising 600 requests/s as throughput conceals the failure.
- Freshness measures age or visibility delay at the user boundary, with event-time and processing-time definitions explicit.
- Availability measures the eligible population that receives a usable outcome, not merely a process that accepts a socket.
- Durability concerns retained correct state across a stated interval and failure model; it cannot usually be validated from ordinary request dashboards alone.
- Recovery objectives bound restoration time, backlog age, lost work, and the interference recovery imposes on new work.
Latency, throughput, freshness, availability, durability, and recovery can conflict. A queue may increase accepted throughput while violating deadlines. Asynchronous replication may improve write latency while widening freshness or recovery exposure. Stronger coordination may protect invariants while consuming latency. Objectives make the trade explicit; they do not eliminate it.
Resolve conflicts at the outcome boundary
When objectives conflict, write an ordering for each workload mode. Ledgerline might require “no duplicate durable transfer” before latency, preserve an explicit rejection deadline before accepted throughput, and reduce optional enrichment before weakening durability. That ordering is a product and correctness decision supported by engineering evidence. A generic instruction to “favor availability” cannot resolve whether accepting an uncertain transfer is useful or harmful.
Expose the mechanism and displaced cost. Keeping utilization low may buy queue headroom but increase provisioned cost. Tight freshness may require coordination or invalidate caches. Lower latency through hedging can increase dependency work and worsen overload. For each proposal, record the objective gained, the objective exposed, the workload mode where the trade appears, and the measurement that would falsify the expected benefit.
Objectives can be conditional without becoming evasive. During a declared regional dependency failure, Ledgerline may admit only high-priority transfers, serve balance reads with a named freshness bound, and publish a longer recovery objective. The degraded population and declaration trigger must be explicit before the event; silently excluding a struggling region after the fact is measurement manipulation.
The SLO matrix makes populations visible
The following illustrative matrix uses Ledgerline. Values are design hypotheses, not recommendations for another system.
| Operation / class | Boundary | Objective shape | Companion indicators | Workload modes |
|---|---|---|---|---|
| Interactive transfer | client submit → durable accepted/rejected outcome | 99% within 250 ms, outcome distributions separate | goodput, duplicate outcomes, unknown outcomes | nominal, peak |
| Balance read | client submit → correct renderable balance | 99.5% within 180 ms; freshness ≤ approved bound | stale-read fraction, cache miss cost | nominal, peak, degraded |
| Bulk reconciliation | scheduled input closed → validated report | 99% before consumer deadline | records/s, validation failures, restart work | nominal, recovery |
| Recovery replay | recovery declared → backlog below safe age | bounded completion and interference | replay goodput, new-work latency, resource share | recovery, disaster |
This matrix prevents a fast interactive population from hiding late batch work and prevents a healthy normal-mode SLO from claiming recovery readiness. Targets require user, correctness, business, and feasibility evidence; this draft supplies only the allocation method.
Offered load is not delivered value
At low demand, offered load and goodput may rise together. Near capacity, queues, timeouts, retries, and rejected or incorrect outcomes can cause goodput to flatten or fall while attempts keep rising.
goodput
  ^                     ───── useful capacity
  |                ____/
  |            ___/      \__ overload collapse
  |        ___/
  |____---____________________________> offered load
       nominal       saturation     overload
The fixture records offered load [100, 200, 300, 400, 500, 600] attempts/s and illustrative goodput [99, 198, 294, 376, 405, 398] outcomes/s. The maximum observed goodput in that synthetic series is 405 outcomes/s; the last point is lower despite more attempts. It does not establish production capacity. It demonstrates why capacity claims need correctness, population, state, and an overload curve.
A familiar rule can fail here: raising concurrency may increase nominal throughput, yet reduce peak goodput when it expands queueing, pool contention, or retry amplification. The changed variable is in-flight work relative to bounded resources. Measure queue age, rejected work, attempt-to-outcome ratio, and recovery time to distinguish the mechanism.
Allocate the journey before negotiating components
For one illustrative Ledgerline path, allocate the 250 ms objective:
| Stage | Nominal allocation | Uncertainty range | Included work |
|---|---|---|---|
| Client | 25 ms | ±5 ms | serialization and client scheduling |
| Network | 30 ms | ±10 ms | client-to-edge transport |
| Edge | 20 ms | ±4 ms | admission, authentication routing |
| Queue | 25 ms | ±15 ms | admitted wait before service execution |
| Service | 60 ms | ±12 ms | application logic and orchestration |
| Dependency | 55 ms | ±20 ms | payment/risk dependency contribution |
| Storage | 35 ms | ±8 ms | durable ledger decision |
| Total | 250 ms | not a sum of independent ± terms | end-to-end hypothesis |
The uncertainty column resists false precision. Do not simply add the ranges unless their dependence and desired bound justify that operation. Network and dependency delay may covary during a regional event; queue and service time may share a saturation cause.
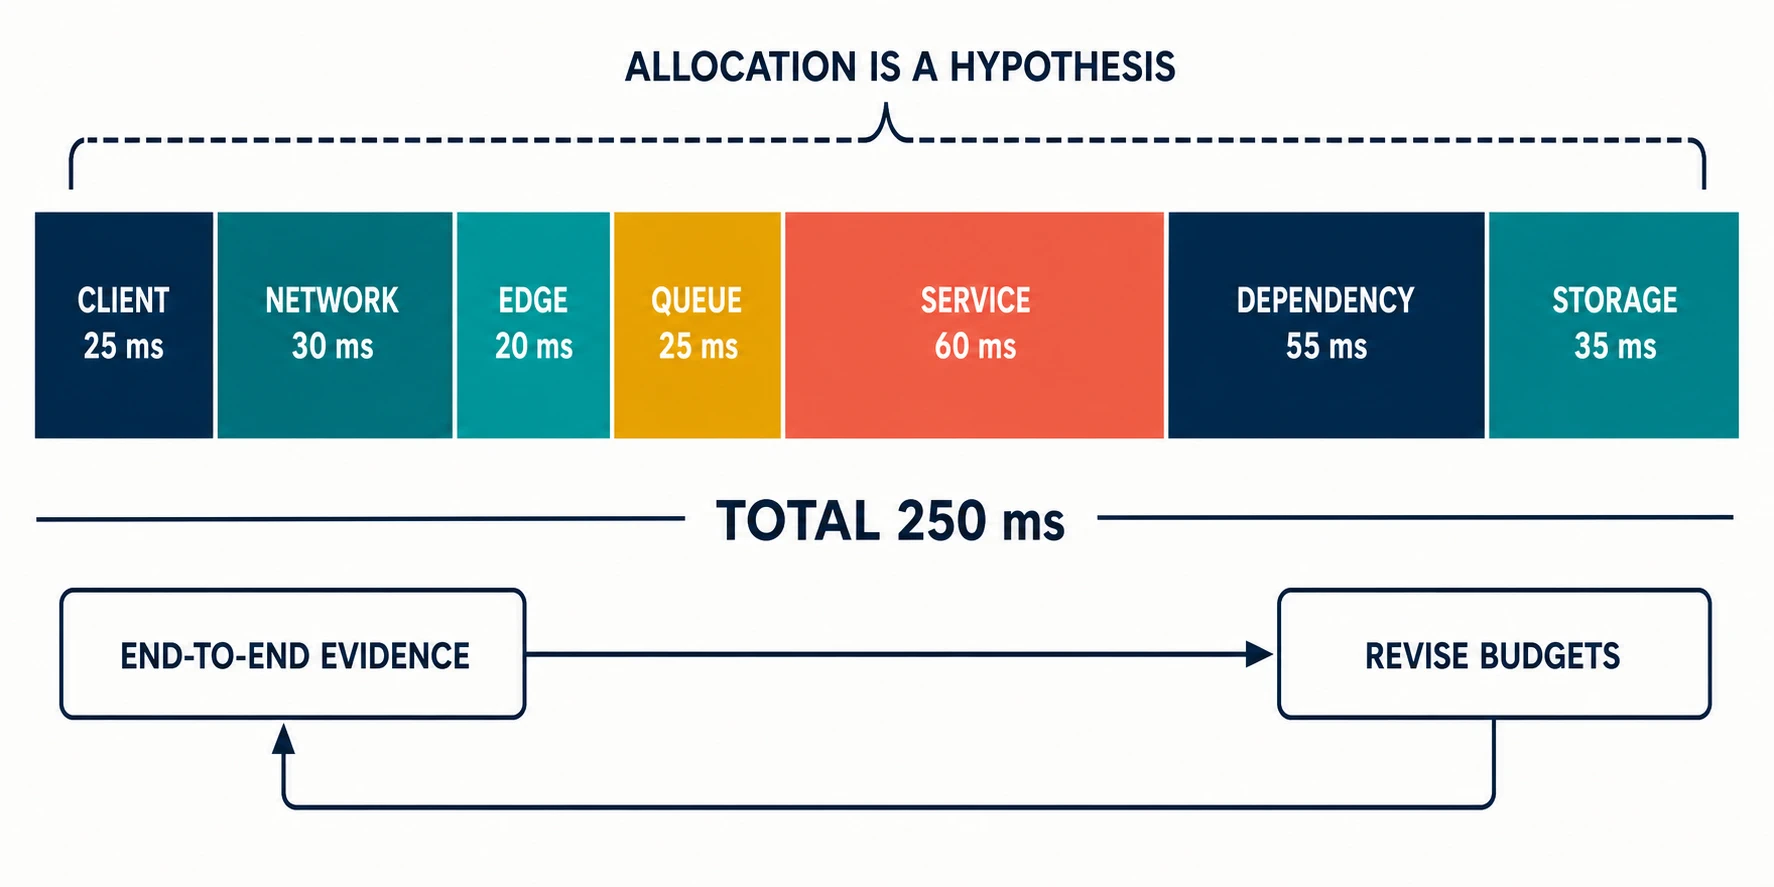
Waterfalls are useful when stages are sequential. Parallel fan-out, hedges, retries, client rendering, and asynchronous durability need a critical-path model rather than naive addition. A 55 ms dependency budget may mean the slowest required branch, not the sum of branches. Define whether timeouts, retry backoff, queue wait, and connection acquisition are included.
Start from the user deadline and correctness path. Estimate unavoidable transport and dependency bounds, reserve uncertainty and overload margin, then allocate the remainder to plausible mechanisms. Validate end to end before enforcing local targets. If storage consistently needs 50 ms to preserve durability while service work uses 35 ms, revising the allocation is better than weakening the invariant or gaming measurement.
Resource budgets connect time to economics
Latency allocation alone can meet the target through unsustainable overprovisioning. Add budgets per useful unit:
- CPU-ms/outcome, separated from host utilization;
- peak and retained memory bytes/worker or tenant;
- storage reads, writes, bytes, and amplification/outcome;
- network bytes and cross-boundary transfer/outcome;
- open connections, concurrent tasks, and queue slots;
- currency/outcome with shared-cost allocation and uncertainty.
Normalize against good outcomes where attempts can multiply. A retry can lower apparent CPU/attempt while increasing CPU/success. Resource budgets should cover nominal, peak, degraded, and recovery modes because failure often changes amplification. They are constraints and diagnostic expectations, not a command to maximize utilization. Headroom has economic value when it preserves overload control, deployment safety, or recovery.
Resource budgets also need a time basis and accounting boundary. “50 CPU-ms per transfer” is consumed work; “eight cores” is provisioned capacity; “70% utilization” is a ratio over an interval. None substitutes for the others. Memory can mean peak resident bytes, retained heap, cache allocation, or working-set demand. Network can mean payload bytes, protocol bytes, replicated bytes, or billed cross-zone transfer. Choose the form that connects a design mechanism to cost or saturation.
A component may satisfy its latency allocation by spending another resource budget. More parallel reads can reduce wall time while multiplying storage operations and connections. A larger cache can reduce dependency latency while increasing memory and invalidation traffic. The worksheet therefore reviews latency, resources, and correctness together. A change is not locally successful until the displaced demand remains inside the end-to-end envelope.
Error budgets and performance burn
An objective that allows 1% bad events over its window has an error-budget fraction of 0.01. If the observed bad-event fraction is 0.024 over a comparable slice, the normalized burn rate is:
burn rate = observed bad fraction / allowed bad fraction
          = 0.024 / 0.01
          = 2.4×
At that rate, the service consumes budget 2.4 times faster than a uniform sustainable rate. Real multi-window burn alerts require careful windowing and event volume; a short quiet interval can produce unstable ratios. The Google SRE Workbook’s burn-rate approach is useful because it connects symptom urgency to remaining budget, but alert thresholds and response policy must fit the service.
A performance error budget applies the same control idea to late or otherwise temporally bad outcomes. Define “bad” at the user boundary and keep correctness failures visible. Do not create separate latency and availability ledgers that double-count or, worse, exclude timed-out unknown outcomes from both. State whether an event can spend multiple budgets and how decisions use that information.
Durability and recovery need longer evidence horizons than request latency. A checksum on a successful write is not a durability SLI by itself; teams may use scrubbing results, restore tests, replica-loss analysis, and reconciliation over stated failure models. Recovery time should begin at a defined impairment or declaration event and end at a defined service-and-backlog state. “Process restarted in five minutes” can be green while twelve hours of replay keeps new-work latency red.
Keep recovery resource budgets explicit: replay bandwidth, rebuild I/O, repair concurrency, cache-warm demand, and the share reserved for new useful work. Otherwise recovery meets its own completion target by causing a second customer-facing incident. A recovery SLO should pair completion time with interference bounds and correctness reconciliation.
Budgets are meaningful only with policy. Examples include pausing risky changes, prioritizing a latency regression, changing admission, reducing optional work, or revisiting an infeasible objective. The response must not reward a team for narrowing the eligible population after the fact.
Local green, user red
Critique this SLO:
99.9% of successful Ledgerline service RPCs complete below 100 ms.
It can remain green while users suffer because it:
- starts after client, network, edge, and queue delay;
- excludes errors, timeouts, cancellations, and unknown outcomes;
- merges operations, regions, payloads, and workload modes;
- says nothing about durable correctness or duplicate outcomes;
- can pass while offered load is rejected before the measured service;
- uses “successful” circularly without defining useful success.
A stronger design keeps a user-boundary SLO authoritative, then uses the service RPC distribution as a diagnostic indicator. Component SLIs explain why the journey is failing; they should not redefine whether it failed.
Another counterexample: tightening every component p99 does not guarantee the end-to-end p99. The slowest 1% may occur on different requests at each stage, fan-out changes order statistics, and cross-stage correlation matters. Measure the journey distribution. Use component budgets to constrain hypotheses and ownership, not to compose percentiles arithmetically.
Avoid brittle local optimization
Derive internal budgets with five rules:
- Preserve the end-to-end boundary. A local dashboard never outranks the journey indicator.
- Allocate mechanisms, not organizations. A queue owned by platform still belongs to the requesting path.
- Attach ranges and assumptions. A point allocation invites false certainty.
- Observe trade movement. Lower CPU can raise bytes, latency, or operational complexity; faster reads can spend freshness.
- Revise globally. When evidence shows a better feasible allocation, update the worksheet and decision record rather than defending historical slices.
This prevents budget theater. A dependency team that beats 55 ms should not be forced to add delay, but downstream consumers also should not silently depend on accidental overperformance. Record internal safety margins and revision triggers.
Revisions require evidence and versioning, not blame. Preserve the old allocation, the workload envelope it assumed, the observation that challenged it, the proposed movement, and the validation/rollback plan. Revisit the end-to-end objective if user research, business value, correctness constraints, or feasible cost changes; revisit local budgets when mechanisms or paths change. A stable objective can have evolving allocations.
Work the 250 ms allocation
Run the companion verifier, then open budget-worksheet.json:
$ node examples/performance-engineering-system-design-handbook/part-01/workload-and-budgets/verify.mjs
workload model: verified 4 segments; peak p99 downstream demand 540 calls/s
budget worksheet: verified 250 ms allocation; observed burn 2.4x
The program confirms that stage allocations sum to 250 ms, uncertainties are nonnegative, indicators have units and scope, goodput never exceeds offered load, and the burn calculation is dimensionless and consistent. It cannot prove that 250 ms has user value, that the allocation is feasible, or that the synthetic goodput curve matches a real service.
Now perform the applied work:
- For each stage, name the start/end events, evidence type, uncertainty source, and one failure path.
- Add a peak-mode allocation without changing the end-to-end objective. Decide whether to reserve more queue margin, reject work, or reduce optional dependency work.
- Add CPU-ms, bytes transferred, connections, and cost per durable outcome. Check units and distinguish provisioned from consumed resources.
- Reallocate 20 ms from one stage to another and state the mechanism or evidence that makes the change plausible.
- Design an end-to-end validation that includes correct accepted, explicitly rejected, timed-out, and unknown outcomes.
- Rewrite the locally green RPC SLO so it remains useful as a diagnostic target without impersonating the user objective.
Self-check the worksheet. Every SLI must state population, boundary, unit, interval, workload mode, and success rule. Percentiles must name their population. Offered load, completion rate, and goodput must be separate. Latency and resource budgets must preserve correctness and include uncertainty. Burn must lead to a pre-agreed decision. At least one piece of end-to-end evidence must be allowed to revise the local allocations.
Decision rules
- Define the user-valued outcome before choosing what telemetry is convenient.
- Treat
p99as incomplete until operation, population, boundary, interval, geography, outcome, and workload state are named. - Use goodput when attempts, retries, rejections, or incorrect completions can diverge from value.
- Allocate latency and resources as hypotheses with uncertainty; never as permanent component entitlements.
- Let end-to-end evidence override local green dashboards and revise budgets when it reveals a better global optimum.
- Use error-budget burn to guide risk decisions only after bad events, windows, volume, and response policy are explicit.
Demand and desired behavior now share compatible units. The next task is to apply the small set of quantitative laws that can test whether those workload and budget assumptions coexist.
Sources and evidence scope
- Google SRE: Service Level Objectives supports the SLI/SLO/SLA distinction, user-centered indicators, distribution awareness, and error-budget framing. It does not supply universal target values.
- Google SRE Workbook: Alerting on SLOs develops multi-window burn-rate alerting. This chapter uses only the normalized burn concept; production policy requires volume and window design.
- OpenTelemetry HTTP metric semantic conventions provide current metric naming, units, and attributes. Instrumentation conformance does not establish a user-journey boundary.
- The Ledgerline matrix, allocations, curve, and verifier are illustrative models. They establish arithmetic and artifact structure, not empirical feasibility or a recommendation for another service.