Performance Engineering and System Design Handbook / Chapter 66
Case Study: Restoring a Latency SLO in a High-Throughput API
Reconstruct a tail-latency failure caused by hidden queues, serial depth, fan-out, and misaligned deadlines, then validate a bounded repair.
Preparing audio…
Audio edition
Case Study: Restoring a Latency SLO in a High-Throughput API
Mercury API’s regional peak report ends with a contradiction:
| Signal | Result |
|---|---|
GET /v2/home median latency |
82 ms |
| p95 latency | 214 ms |
| p99 latency | 487 ms |
| p99 objective | ≤300 ms |
| regional API fleet mean CPU | 43% |
| successful request rate | 18,400 requests/s offered |
The response is fast for most customers. The fleet appears to have more than half its CPU unused. Yet roughly the slowest percentile misses the objective by 187 ms during predictable peaks. Adding hosts two weeks earlier did not materially move p99.
That failed result is the beginning of the case, not proof of a conclusion. Low mean CPU does not establish spare capacity in every executor, connection pool, dependency, or traffic class. A p99 regression does not identify a p99 component. “The endpoint has eight calls” does not reveal which are serial, parallel, optional, queued, or still executing after the caller leaves.
The design lesson is: low average utilization can coexist with catastrophic tail latency when bounded pools, serial dependencies, and fan-out dominate. Restoring the objective requires reconstructing the work graph and its temporal ownership, not selecting the most familiar latency tactic.
This case makes the reasoning visible. The numbers are deterministic modeled and simulated teaching evidence, not measurements from a named production system. The companion packet lets you reproduce the arithmetic and interrogate the design.
Part VIII asks the handbook’s method to survive whole engineering engagements rather than isolated mechanisms. Mercury is the first proof: an ambiguous symptom must become a workload boundary, causal model, design decision, adverse-state test, migration, and production observation without hindsight making the path look inevitable.
The case file is deliberately incomplete
The first incident note says only: “Home API p99 above 300 ms at the regional peak; CPU normal; profile service sometimes slow.” It omits the questions that control the design:
- Which request population defines the objective: attempts, successes, cancellations, cache hits, or customer-visible completions?
- Does a response remain correct when optional enrichment is absent, and can the client distinguish omission from an empty result?
- What is the regional endpoint mix, tenant skew, payload distribution, and retry behavior?
- Which calls are serial, which fan out, and which state is authoritative?
- Where does work wait before a visible span begins?
- Do downstream operations inherit the caller’s remaining time and cancellation?
- What happens during dependency slowdown, failover, and recovery?
- Which change can roll back without corrupting cache, authorization, or response semantics?
The team answers enough to form a boundary. The unit of work is one regional customer request to GET /v2/home. The 28-day SLO population includes successful, non-cancelled requests observed at ingress. It excludes synthetic probes and declared load tests, but it does not exclude a request merely because an optional branch was slow. A correct core response contains profile, entitlement, inventory, and pricing fields. Recommendation and reputation enrichment may be omitted only when the response carries an explicit partial marker; clients must not interpret omission as an authoritative empty value.
The target is ingress p99 no greater than 300 ms for that population. Error rate, completeness, late work, and dependency load are guardrails. Improving p99 by converting slow correct results into failures would not satisfy the objective.
An evidence timeline, including the wrong turn
The team records hypotheses before changing the system. That prevents later evidence from rewriting the story.
| Time | Hypothesis | Discriminating evidence | Result |
|---|---|---|---|
| Monday 09:00 | API hosts are CPU-bound at peak | per-core run queue, CPU profile, throttling, service demand | not supported; fleet mean 43%, no corresponding per-core or quota cliff |
| Monday 13:00 | profile computation is intrinsically slow | profile service-time distribution separated from client wait | incomplete; service time rises modestly, client wait rises sharply |
| Tuesday 10:00 | more API replicas will absorb the tail | canary with 25% more hosts, same pool settings and traffic mix | failed; p99 changes from 487 to 476 ms within run variation |
| Tuesday 16:00 | hidden queues and late work occupy bounded pools | executor active count, pool pending time, cancellation-to-stop delay | supported; endpoint slots 94.06% occupied, profile pool 95.95%, late work material |
| Wednesday 11:00 | serial depth and fan-out amplify modest dependency tails | request DAG, per-branch distributions, critical-path traces | supported, with dependence caveat |
The 11 ms p99 movement after adding hosts is not evidence that capacity never matters. It shows that this capacity change did not expand the controlling boundary. Each API process retained the same 640-slot endpoint executor and 420-slot profile connection pool, traffic placement preserved hot enterprise concentration, and downstream capacity did not change. A larger fleet reduced host-level CPU pressure while leaving per-process queue behavior and dependency work almost intact.
The failed experiment was valuable because it falsified a specific mechanism. “Scaling did not work” would be too broad. Scaling the resource that owns the constrained queue, changing placement, or lowering per-request demand could still help.
Reconstruct the workload before reading the traces
At the affected regional peak, Mercury receives 18,400 requests/s:
| Class | Mix | Offered load | Distinguishing work |
|---|---|---|---|
| standard | 72% | 13,248 requests/s | core response, recommendation sampled |
| premium | 23% | 4,232 requests/s | core plus recommendation and reputation |
| enterprise | 5% | 920 requests/s | larger profile, more inventory partitions, both optional branches |
The five-percent enterprise class contributes disproportionately to dependency fan-out and response bytes. Aggregating only by endpoint hides that class. Aggregating by tenant would expose skew but create high-cardinality telemetry and privacy risk, so the steady metric path uses bounded workload classes and size buckets. Authorized sampled traces retain tenant context under limited access for diagnosis.
Arrival rate is also insufficient. Peak traffic arrives in short correlated waves after mobile notification batches. The one-minute average is 18,400 requests/s, while one-second windows reach 22,700 requests/s. Retries from upstream clients are included as attempts, not silently folded into logical requests. The chosen SLO population counts final ingress outcomes, while capacity models charge every attempt.
These distinctions matter because a pool can saturate during a one-second wave while fleet CPU remains moderate over a minute. The team versions the reconstructed mix as mercury-home-peak-v4; every test and design claim names that workload.
The call graph reveals the temporal design
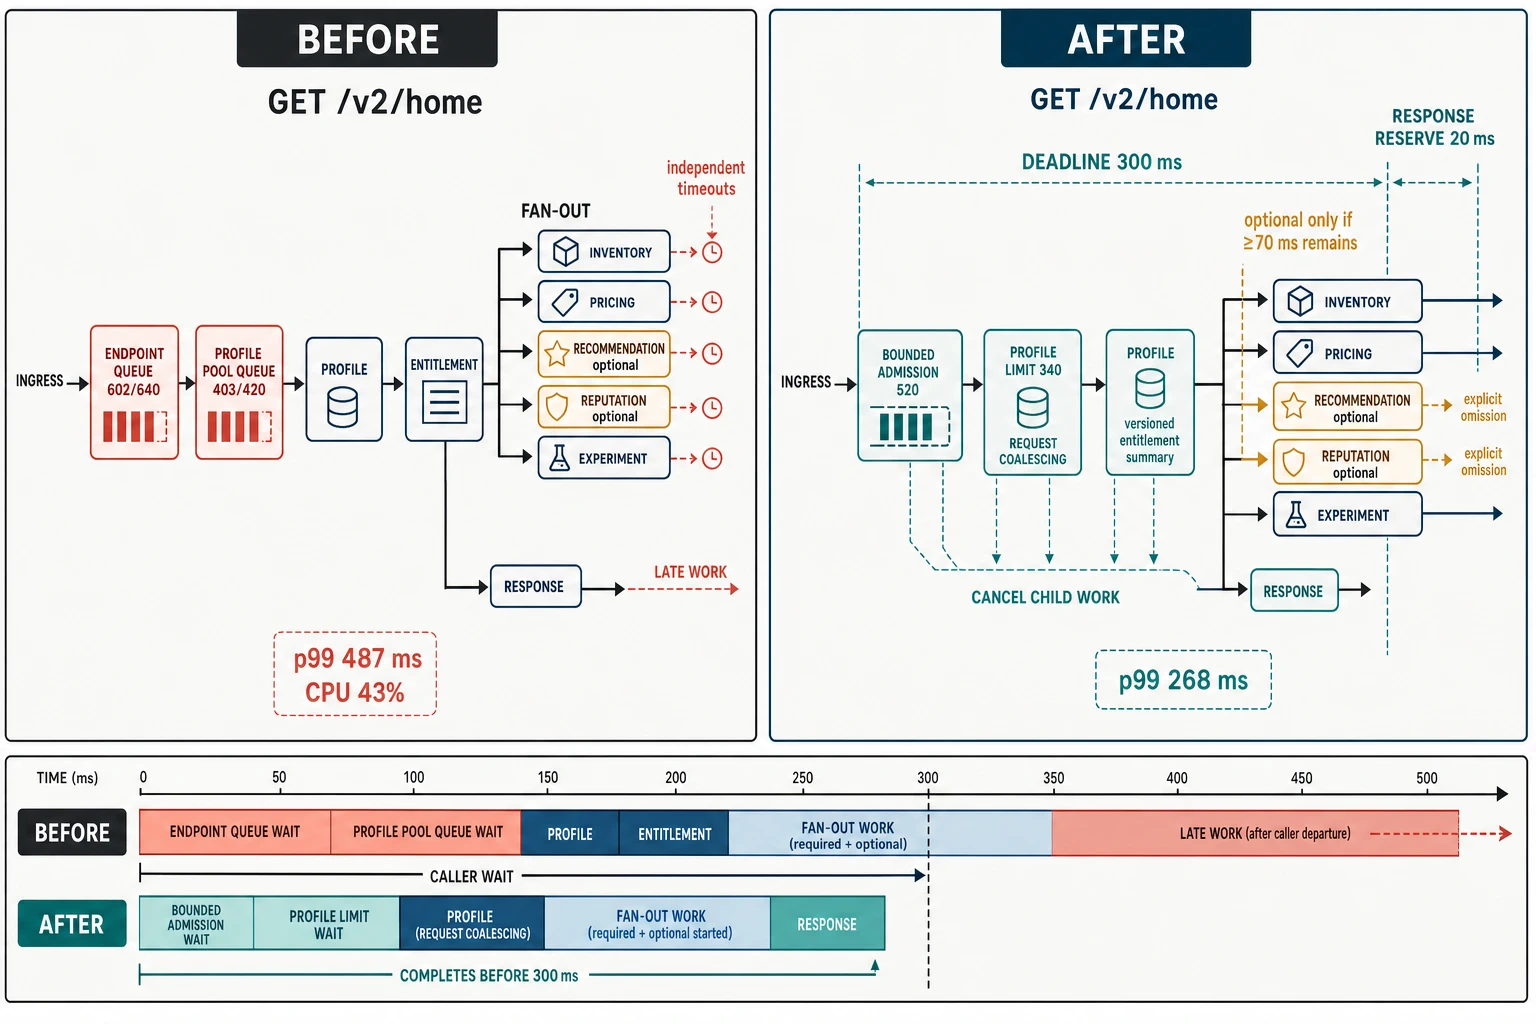
The endpoint grew from one authoritative profile read to eight synchronous units of work: local assembly plus seven remote dependencies.
ingress
  └─ local request validation and context
      └─ profile (mandatory, remote)
          └─ entitlement (mandatory, remote, serial after profile)
              ├─ inventory (mandatory, remote)
              ├─ pricing (mandatory, remote)
              ├─ recommendation (optional, remote)
              ├─ reputation (optional, remote)
              └─ experiment allocation (mandatory, remote)
                  └─ assemble, serialize, respond
Inventory, pricing, recommendation, reputation, and experiment allocation run in parallel only after profile and entitlement complete. The request latency is therefore closer to:
L_request = L_ingress + L_profile + L_entitlement
          + max(L_inventory, L_pricing, L_recommendation,
                L_reputation, L_experiment)
          + L_response
where every term includes its relevant queue and service time. This is a structural expression, not permission to add component percentiles. The p99 request does not necessarily contain the p99 observation of every component, and the branch distributions are correlated by workload class, shared pools, deployments, and dependency state.
The entitlement call uses profile identity and returns claims needed by the core response. Historical layering, not a correctness requirement, made it a separate serial RPC. Recommendation and reputation are semantically optional but temporally mandatory in the old implementation: assembly waits for them until their independent 400 ms timeouts.
Hidden queues explain the low-CPU tail
The first distributed traces showed dependency spans but not the time waiting to start them. Queue instrumentation changes the decomposition.
At peak, 602 of 640 endpoint executor slots are active: 94.0625% occupancy. The profile client has 403 of 420 connections active: 95.9524%. Pending acquisition time sits outside the profile server span. A request may therefore wait in the endpoint executor, begin its trace, and later wait again for a profile connection while the dependency itself reports acceptable service time.
The slow-request timeline is representative, not a sum of component p99s:
| Interval from ingress | Owner | State | Evidence |
|---|---|---|---|
| 0–7 ms | API | parse, authenticate, validate | ingress span |
| 7–94 ms | endpoint executor | waiting for runnable slot | queue event added during investigation |
| 94–101 ms | API | local preparation | CPU span |
| 101–168 ms | profile pool | waiting for connection | client-pool histogram |
| 168–232 ms | profile | RPC service and network | client/server spans |
| 232–271 ms | entitlement | serial RPC | client/server spans |
| 271–438 ms | fan-out | wait for slowest required-or-temporally-required branch | child spans |
| 438–487 ms | API/client | serialization, network, scheduling | ingress and egress spans |
Only about 110 ms in this trace is dependency service and network time before fan-out. Queue wait consumes 154 ms. The optional recommendation branch owns the fan-out maximum. Fleet CPU can remain low while requests hold executor slots waiting for connections and downstream responses.
The queue has two harmful feedbacks. First, a queued request holds temporal budget without doing useful work. Second, old independent timeouts allow work to continue after the 300 ms ingress objective is impossible. About 20% of peak attempts perform an estimated mean 85 ms of work after the caller has departed or the objective has been lost. At 18,400 requests/s, the modeled late-work population is:
18,400 requests/s × 0.20 × 0.085 s/request
  = 312.8 concurrent late requests
That result is average concurrent late requests, not CPU cores or throughput. Some late requests wait; others consume CPU, sockets, or paid dependency work. They occupy capacity that newer requests need, extending queues and producing more late work.
Fan-out makes modest tails visible
For a teaching bound, suppose the seven remote calls have independent slow-event probabilities of 1.5%, 2.0%, 1.2%, 1.8%, 4.0%, 2.5%, and 1.0% for one request class. The probability that at least one is slow is:
P(any slow) = 1 − product from i=1 to 7 of (1 − p_i)
            = 13.2156%
Every symbol is dimensionless: p_i is the slow-event probability for branch i under the specified class and window. The calculation answers a limited question—how parallel opportunities can expose a tail even when each branch is usually fast. It does not predict Mercury production p99. Independence is false when branches share workload size, network path, host contention, or regional failure. Serial calls also affect whether later branches start at all.
The Tail at Scale explains the general phenomenon: rare component slowdowns become increasingly important when a service waits across many components. Mercury still needs its own traces and tests because the paper does not specify this endpoint’s pools, dependence, correctness, or workload.
A common misuse is to read 13.2156% as “13.2% of requests violate 300 ms.” Slow events have different thresholds and overlap with available budget. The calculation ranks fan-out as a plausible mechanism. The load test and production distribution decide the objective.
Compare interventions at the controlling boundary
The team compares five proposals against correctness, latency distribution, constrained work, failure behavior, rollout, and reversal.
| Proposal | Mechanism | Why it could help | Why it is not sufficient or selected alone |
|---|---|---|---|
| add API capacity | more process slots and placement options | absorbs real API CPU or per-process concurrency pressure | previous canary did not expand dependency or fixed-pool boundary; costs more and preserved late work |
| reduce call depth | remove a serial coordination boundary | returns temporal budget to every request | requires entitlement authority and versioning to move safely |
| cache/coalesce profile reads | avoid duplicate remote work | reduces pool demand during correlated waves | needs identity, authorization, freshness, invalidation, and failure semantics |
| hedge slow reads | duplicate selected work after delay | can reduce independent straggler impact | broad use increases load on pools already saturated and complicates cancellation |
| degrade optional results | stop waiting for low-value branches when budget is low | protects correct core goodput | requires explicit response semantics and product acceptance |
“Increase the connection pool from 420 to 800” is treated as moving the queue, not deleting it. If profile safe capacity cannot serve the additional concurrency, the larger pool raises dependency queueing and recovery pressure. “Cache the home response” is rejected because entitlement, inventory, pricing, and experiments have different authority and freshness boundaries. A broad object cache would make invalidation and authorization harder than the diagnosed problem.
The selected design is a bundle because no single mechanism repairs the whole temporal contract:
- propagate the 300 ms ingress deadline and cancellation through every branch, reserving response time;
- admit at 520 endpoint operations and 340 profile operations per process, before their queues become unbounded;
- coalesce concurrent identical profile reads within a short freshness window and strict identity scope;
- move required entitlement claims into the versioned profile response, removing one serial hop; and
- start optional work only when at least 70 ms remains, then mark omission explicitly.
The bundle complicates attribution. To preserve causal evidence, the team first shadows deadline decisions, then enables cancellation, then bounds concurrency, then enables coalescing, then migrates entitlement claims, and finally enables degradation. Each phase has its own comparison and abort threshold.
Deadlines assign ownership of time
The ingress deadline is an absolute completion boundary at the receiving process. Each outgoing call receives the remaining duration minus a local response reserve; independent 400 ms and 500 ms timeouts are removed. The service reserves 20 ms for final assembly and response, and an optional branch does not start with less than 70 ms remaining.
The gRPC deadline guidance distinguishes a deadline from a timeout and describes deadline propagation using elapsed-time-aware remaining duration. Its cancellation guidance also notes that server application work must cooperate with cancellation; notification alone does not interrupt arbitrary handler code. Mercury therefore tests cancellation-to-stop delay inside each handler and cancels child work when the parent loses interest.
Cancellation does not roll back effects. GET /v2/home branches are read-like, but experiment allocation records an exposure. That write uses an idempotent event identity and may complete after the response is cancelled. The core response does not claim the event was absent merely because the RPC ended. Deadline propagation is a temporal resource rule, not a transactional undo mechanism.
The original deadline plan also failed by budgeting every hop independently. A 300 ms ingress objective cannot support 400 ms per dependency. The repaired implementation passes remaining time and uses phase-specific stop conditions:
if remaining < 20 ms: stop and return deadline outcome
run mandatory branch only if its bounded worst useful work fits remaining - 20 ms
run optional branch only if remaining >= 70 ms
on parent cancellation: cancel children and verify handlers release pools
never retry after remaining time cannot cover backoff + useful attempt + reserve
These are policy conditions, not proof that 70 ms is universal. The load envelope and optional-branch benefit set that value.
Bounded concurrency controls where waiting occurs
The endpoint limit falls from an effectively saturated 640 slots to an admitted bound of 520. The profile client admits at 340 active operations instead of allowing requests to occupy 420 connections plus a hidden pending queue. Limits are applied per process and partitioned so the enterprise class cannot occupy every slot.
Reducing a limit sounds counterintuitive when latency is bad. The change protects work that can still finish. Requests beyond the safe concurrency receive a bounded overload response or optional degradation before they hold scarce state. Queue age becomes observable at admission, rather than accumulating in several hidden locations.
The selected numbers come from a load frontier, not from copying observed occupancy. For each limit pair, the team measures core goodput, p99, rejection, pool occupancy, dependency demand, and recovery. Limits below 480/310 leave useful capacity idle in the teaching environment. Limits above 560/370 increase queue age sharply during the slowdown state. The 520/340 pair leaves modeled headroom for variation and preserves the best core goodput across the tested envelope.
An adaptive limiter remains a future option. It is not introduced in the first repair because its control signal and recovery dynamics would add another hypothesis. A static, versioned bound is easier to validate while the service learns its boundary.
Coalescing removes duplicated work without inventing authority
During notification waves, 26% of requests ask for the same profile identity within the permitted freshness window. Their mean coalescing group size is 2.6. At 18,400 requests/s:
eligible requests = 18,400 requests/s × 0.26
                  = 4,784 requests/s

leader calls      = 4,784 requests/s ÷ 2.6 requests/leader
                  = 1,840 calls/s

avoided calls     = 4,784 − 1,840
                  = 2,944 profile calls/s
The key is not just a profile ID. It includes tenant boundary, subject, authorization-policy version, response schema, and freshness class. A follower may join only while the leader’s deadline can satisfy it; a short-deadline follower must not shorten the leader for everyone else. Cancellation removes the follower’s interest, and the leader is cancelled only when no eligible waiter remains. Errors are shared only for the in-flight operation and are not retained as a durable negative cache.
This is request coalescing, not a general profile cache. It reduces duplicate concurrent work without claiming freshness beyond the live operation. If profile service fails, coalescing can concentrate many waiters on one failure, so admission charges followers and leaders separately for response capacity even though only leaders consume remote calls.
Pruning the serial path requires a state migration
The entitlement hop returns claims derived from the same authoritative policy version already consulted by profile. The team changes the profile response to carry a signed, versioned entitlement summary with subject, tenant, policy version, issue time, expiry, and revocation epoch. The API validates it locally and preserves the security boundary described in Chapter 63.
Migration uses expand, observe, cut over, and contract:
- profile emits both the old-compatible response and new optional entitlement summary;
- API validates the summary in shadow and compares it with the old entitlement call;
- mismatches block cutover and retain sampled forensic evidence under the declared retention policy;
- a small canary uses the summary as authority while retaining rapid fallback to the call;
- exposure expands by workload class and region; and
- the old call is removed only after the compatibility window and rollback boundary expire.
The removed hop contributes 31 ms to p99 in the teaching packet, but the benefit is larger than service time alone: later parallel branches begin earlier, and one queue and failure boundary disappears. Rollback remains safe only while both response versions and the old entitlement path are supported. After contraction, restoring the call is a forward change, not an instant rollback.
Optional degradation preserves meaning
Recommendation and reputation are useful, but the response remains core-correct without them. Under the old implementation, “optional” described product semantics while the scheduler treated both as mandatory. The repaired path checks remaining budget before launch and cancels optional work when it can no longer complete usefully.
The response includes:
{
  "core_complete": true,
  "optional": {
    "recommendations": "omitted_deadline_budget",
    "reputation": "present"
  }
}
Clients are versioned to distinguish absent, empty, and omitted. Metrics count omission by cause and workload class. During normal peak, the regression budget allows no more than 8% optional omission; the modeled result is 3.4%. During the injected dependency slowdown, omission reaches 19% while core correctness remains 100% and p99 remains 296 ms. That is an explicit degraded mode, not a hidden success.
If product owners later declare recommendation mandatory for a class, the class needs a different objective or more capacity. The system cannot preserve an optional-degradation design after changing the invariant by vocabulary alone.
Broad hedging loses at saturation
The team simulates hedging profile reads after a delay. At moderate load with independent replica stragglers, a narrow hedge reduces some tail observations. At peak, duplicate attempts consume the same client pool and profile capacity. The extra demand raises queue age, and cancellation frequently arrives after both attempts have started. Core goodput falls in the slowdown state.
Broad hedging is therefore rejected from the selected bundle. A future experiment may hedge a small, idempotent, high-value read class against a separate capacity cell with a retry/hedge budget and prompt loser cancellation. Writes, experiment effects, and operations sharing the saturated boundary are excluded.
The lesson is not “never hedge.” It is that tail-tolerance mechanisms spend capacity. Their benefit depends on replica independence, trigger delay, cancellation speed, current utilization, and effect semantics.
The validation matrix includes recovery
The load plan tests three states with mercury-home-peak-v4:
- regional peak: target mix with one-second waves and declared tenant skew;
- dependency slowdown: profile and recommendation distributions shifted while capacity remains fixed; and
- recovery: slowdown removed while queued, cancelled, coalesced, and retry work drains.
Each state runs twelve independent 15-minute steady-state intervals after ten minutes of warm-up on 24 isolated 8-vCPU API workers and deterministic dependency emulator version 1. Generator peak CPU is 41%; generator clock error p99 is 0.7 ms. Correctness assertions verify core fields, entitlement comparison during migration, omission markers, duplicate experiment outcomes, and cancellation cleanup. The raw teaching inputs and analyzer are retained in the companion directory.
Before and after evidence
| State | Before p99 | After p99 | Before core goodput | After core goodput | Important after-state evidence |
|---|---|---|---|---|---|
| peak | 487 ms | 268 ms | 97.3% | 99.5% | queue age p99 8 ms; profile occupancy 78%; optional omission 3.4% |
| dependency slowdown | 824 ms | 296 ms | 91.0% | 98.7% | core correctness 100%; optional omission 19% |
| recovery | 619 ms | 281 ms | 93.6% | 99.2% | steady state restored in 4.5 min versus 14 min |
Core goodput means correct core responses completed within the applicable objective divided by offered logical work in the test state. It is not raw throughput. The table’s percentages are fixed simulated teaching observations, not confidence intervals inferred from live requests.
Peak p99 improves by 219 ms, or 44.9692% relative to 487 ms. That precision is preserved only so the fixture can be checked; prose should call it approximately 45% because the teaching environment does not support four significant figures of transfer. Median moves from 82 to 76 ms. The much larger tail movement supports the queue/topology mechanism better than a universal speedup claim.
Late work falls from a modeled 312.8 concurrent requests to:
18,400 requests/s × 0.015 × 0.015 s/request
  = 4.14 concurrent late requests
The 1.5% and 15 ms inputs come from the after-state fixture. A production rollout must remeasure them; the model cannot prove handler cleanup in another runtime.
Reproducible load-test report
- Claim: the selected bundle restores the 300 ms peak p99 objective while preserving core correctness and improves behavior during slowdown and recovery.
- Boundary: one Mercury API region,
GET /v2/home, ingress observation to completed response. - Unit of work: one logical regional customer request; attempts separately charged to capacity.
- Workload: 18,400 requests/s one-minute peak with 22,700 requests/s one-second waves; 72:23:5 class mix; version
mercury-home-peak-v4. - Environment: 24 isolated 8-vCPU workers; deterministic dependency emulator v1; fixture dated 2026-07-14.
- Warm-up and steady state: 10 minutes warm-up, 15 minutes measured, 12 independent runs per state.
- Results: the before/after table above; peak after p99 268 ms and goodput 99.5%.
- Correctness: core response completeness, entitlement shadow comparison, optional markers, idempotent experiment effects, and cancellation cleanup checked.
- Generator validation: peak CPU 41%; p99 clock error 0.7 ms; offered versus accepted attempts reconciled.
- Raw and reproduction path:
examples/performance-engineering-system-design-handbook/part-08/latency-slo-case-study/. - Uncertainty: fixed simulated runs model only the declared distributions; they do not estimate production confidence or rare regional events.
- Transfer limits: runtime scheduling, network dependence, tenant concentration, dependency versions, cache policy, and production failure modes may differ.
Run the packet:
cd examples/performance-engineering-system-design-handbook/part-08/latency-slo-case-study
node analyze.mjs
node verify.mjs
It reproduces class rates, 13.2156% independence-model fan-out bound, pool occupancy, late-work populations, 2,944 avoided profile calls/s, 219 ms peak p99 movement, and every regression-budget comparison.
Guard against a false before-and-after story
A large p99 movement can still be an invalid comparison. Mercury’s review tries to break the result in five ways before accepting it as rollout evidence.
Population drift. The before and after samples must contain the same success definition, workload classes, response semantics, and exclusion rules. The new optional marker creates a particular trap: if after-state queries exclude degraded responses, the reported distribution will improve by definition. The primary latency population retains correct explicitly degraded responses. A separate completeness measure shows what the latency query cannot.
Mix and placement drift. The team compares each class as well as the declared 72:23:5 mixture. It records one-second arrival waves and placement concentration. A canary receiving mostly standard traffic or receiving fewer hot tenants cannot be compared with the regional aggregate without reweighting and an explicit approximation. Reweighting still cannot reconstruct a missing enterprise failure mode.
Coordinated omission. A generator that waits for a response before scheduling the next request reduces offered load when the system slows and under-samples the worst intervals. Mercury’s generator follows the versioned arrival schedule independently of completions, accounts for rejected and cancelled attempts, and reports when it cannot maintain the schedule. Queue collapse must not make the load source polite.
Warm-up and recovery leakage. Coalescing tables, connections, code paths, and dependency emulators need a declared warm state. The ten-minute warm-up is excluded from the peak steady-state result but is not discarded from the recovery study. Recovery begins from a deliberately impaired state and ends only when queue age, pool occupancy, goodput, and dependency demand return inside bounds. Declaring recovery when p99 first crosses 300 ms would ignore a backlog capable of causing a second collapse.
Aggregation error. Mercury computes the endpoint distribution from request observations at the relevant regional boundary. It does not average host p99s or fifteen-minute p99 values. Per-host and per-class distributions remain diagnostic views. The final SLO calculation uses the defined event population; if the telemetry backend approximates quantiles from histograms, bucket scheme and merge behavior are versioned with the result.
The same discipline applies to traces. Tail-biased sampling is useful for finding slow paths, but the fraction of sampled traces containing a queue is not the queue’s production prevalence. Metrics establish the distribution and occupancy; trace exemplars expose representative causal paths; controlled tests vary the suspected mechanism. These evidence types reinforce one another without being treated as interchangeable.
Alternative explanations after the repair
The team asks whether the bundle merely hid latency somewhere else.
- More rejection? Peak core goodput rises to 99.5%; accepted, rejected, cancelled, and completed attempts reconcile with offered load.
- More dependency work? Profile calls fall by the modeled coalescing amount, and broad hedging is absent. Experiment effects remain idempotent.
- Less correct work? Core correctness stays at 100% in the fixture; optional omission is visible and separately budgeted.
- More client work? Response bytes and client render timing remain guardrails; the server does not move assembly or filtering into clients.
- A cheaper test state? The dependency slowdown and recovery tests deliberately make the environment harder than the normal peak.
- A temporary cold-path escape? Entitlement shadow comparison and mixed-version behavior remain active through the compatibility window.
None of those checks proves that production has no displaced cost. They make the displacement observable enough for a staged decision. CPU service demand per core response, dependency attempts per logical request, response bytes, optional value, telemetry cost, and operator toil remain part of the post-launch comparison.
Recovery is its own capacity problem
The old system needed 14 minutes to return to steady state after the dependency slowdown. During those minutes, queued attempts, late work, retries, cold connections, and fresh arrivals competed. Removing the slowdown increased theoretical completion capacity, but the backlog could still keep utilization near the unstable region.
The repaired system suppresses retries whose remaining deadline cannot support a useful attempt, cancels abandoned children, bounds new admission, and drains coalesced leaders without launching one dependency call per waiter. Operators keep optional degradation active until queue age and pool occupancy remain inside bounds for two observation intervals. They do not disable protection at the first healthy percentile.
The modeled 4.5-minute recovery is therefore a separate result, not an automatic consequence of 268 ms peak p99. A design could improve normal latency and recover worse if it accumulated hidden state or restored traffic too aggressively. Every rollout phase repeats the recovery transition because cancellation, admission, coalescing, and entitlement migration each change what work survives a fault.
Rollout uses exemplars and stop conditions
The team cannot expose all five changes at once and still know what failed. Rollout phases are:
- emit queue, remaining-budget, cancellation, coalescing, and omission signals without changing decisions;
- propagate deadlines in shadow and compare intended versus current stop behavior;
- enable cancellation for one percent, checking incomplete side effects and pool release;
- enable bounded concurrency by class, with overload response and queue-age aborts;
- enable coalescing for one scoped profile class;
- shadow and canary the entitlement summary migration;
- enable optional degradation; and
- expand regionally while retaining phase-specific reversal.
The peak regression budget is:
| Signal | Boundary | Abort or hold threshold |
|---|---|---|
| ingress p99 | declared successful regional population | >300 ms |
| endpoint queue-age p99 | admitted GET /v2/home work |
>12 ms |
| profile pool occupancy | active admitted profile operations | >82% |
| late-work fraction | attempts executing after caller departure | >2% |
| optional omission | normal regional peak | >8% |
| core correctness | all tested states | <100% |
No one averages these into a launch score. A correctness failure blocks. A latency or operating-boundary failure holds exposure and triggers diagnosis. An optional-omission breach may require more capacity, a different threshold, a narrower class, or product acceptance—never relabeling.
Histograms carry trace exemplars for selected bad buckets, so an operator can jump from a p99 or queue-age observation to representative request paths. OpenTelemetry’s metrics data model defines exemplars as metric values associated with trace context; the backend and sampling plan still determine whether Mercury retains a useful example. Exemplars do not replace unbiased aggregate distributions.
Production comparisons use matched workload class, region, release, and dependency state. The canary is not declared successful merely because its overall p99 is lower; routing a lighter class to it would create selection bias. The team compares service demand, queue age, pool occupancy, cancellation delay, dependency attempts, correctness, omission, and cost as well as latency.
The compact decision record
Decision: repair Mercury home-path temporal control with propagated deadline and
cancellation, 520/340 admitted bounds, scoped in-flight profile coalescing,
versioned entitlement summary, and budget-aware optional degradation.

Outcome: p99 <=300 ms for successful non-cancelled regional customer requests;
core response correct; normal-peak optional omission <=8%.

Evidence: mercury-home-peak-v4 model; queue and pool instrumentation; failed
25%-host canary; 12-run peak/slowdown/recovery packet; migration comparison.

Rejected: capacity-only because tested host capacity did not expand the controlling
boundary; larger pool because it transfers queueing; broad cache because authority
and freshness differ; broad hedge because duplicate work worsens saturated states.

Rollout: shadow temporal decisions; cancellation; admission; coalescing;
expand/compare/cut over entitlement; degradation; regional expansion.

Rollback: phase-specific until entitlement contraction. After contraction, restore
the old call only through a forward compatible change.

Residual risks: production branch dependence, workload-class drift, hot-tenant
placement, cancellation cooperation, coalescing failure concentration, optional
value loss, and entitlement revocation behavior.

Revisit: p99 >300 ms; queue age >12 ms; pool occupancy >82%; late work >2%;
normal omission >8%; core mismatch; dependency or workload mix changes 15%;
or recovery exceeds 6 minutes in two exercises.
The decision is bounded to this endpoint and workload. It does not establish a fleet-wide concurrency limit or permission to cache authorization decisions elsewhere.
What the repair does not prove
The model and tests do not prove branch independence, production confidence intervals, safety under every regional failure, or correct behavior in every client version. The dependency emulator cannot reproduce unknown kernel scheduling, network congestion, control-plane failure, or a real provider quota. The entitlement migration needs independent security and correctness review. Optional degradation needs user and business evidence, not only latency evidence.
Several counterfactuals change the answer:
- If profile work is CPU-saturated with independent replica tails and separate hedge reserve, a narrow hedge may beat coalescing.
- If entitlement is independently authoritative and cannot issue a safely verifiable summary, removing the hop violates correctness; the team must budget, parallelize, or materialize differently.
- If recommendation becomes mandatory, degradation is not available and the 300 ms objective may require more capacity or less other work.
- If traffic has little identity overlap, coalescing saves almost nothing.
- If API CPU becomes the first constraint after pruning, host capacity can become the next correct intervention.
- If cancellation handlers fail to stop local work, propagated deadlines can improve caller latency while leaving the overload loop intact.
The production observation contract must therefore continue after the p99 graph improves. Workload mix, one-second bursts, tenant concentration, dependency distributions, late work, and recovery time remain model inputs with owners.
Diagnostic drill
A later release reports these matched-peak observations:
ingress p99: 318 ms
fleet mean CPU: 46%
endpoint queue-age p99: 9 ms
profile pool occupancy: 79%
late work: 1.4%
optional omission: 3.1%
pricing client wait p99: 71 ms (was 18 ms)
pricing server service p99: 22 ms (was 20 ms)
enterprise mix: 9% (was 5%)
Rank three hypotheses and name a discriminating check for each. Decide whether to raise endpoint concurrency, add API hosts, degrade pricing, or hold the rollout.
Diagnostic answer guide
The pricing client-wait increase without corresponding server-service movement points first to a client pool, placement, or upstream queue rather than pricing computation. The enterprise mix shift can increase partition fan-out or exhaust a class-specific pool. Check pricing pool pending/active counts by bounded workload class, request DAGs for enterprise fan-out, placement concentration, and the changed workload manifest.
Endpoint queue age, profile occupancy, and late work remain inside their budgets, so raising endpoint concurrency is unsupported and could transfer more demand to pricing. API host addition is also weak without a per-process or placement mechanism. Pricing is core-required in this case, so silently degrading it violates the invariant. Hold or restrict the release while testing pricing admission/placement and workload-class capacity. A valid alternative may add pricing capacity if its safe boundary and failure reserve are the demonstrated constraint.
Design exercise
Redesign the selected bundle under one changed assumption: recommendation is mandatory for premium and enterprise requests, while standard requests may omit it. Produce class-specific objectives, admission partitions, deadline rules, capacity evidence, overload behavior, and rollout conditions. Explain whether coalescing, capacity, hedging, or materialization changes.
Design answer guide
A strong answer creates separate populations or an explicitly weighted product objective rather than hiding premium failures in the aggregate. Premium and enterprise admission need reserved capacity or a fair partition; standard optional work must not occupy the mandatory branch’s last slots. The recommendation deadline must fit the remaining end-to-end budget, and overload must reject or degrade another declared feature rather than return an incomplete mandatory response.
Materializing recommendations can help if freshness, authority, invalidation, privacy, and miss behavior are acceptable. Narrow hedging needs independent capacity and idempotent reads. Capacity is appropriate when the recommendation boundary is verified as first saturation under peak, slowdown, failure, and recovery. The answer is incomplete without migration, cache-warm or materialization-rebuild behavior, correctness checks, and class-specific production evidence.
Field review card
When p99 rises while average utilization looks safe:
- Define the request population, success, correctness, and observation boundary.
- Reconstruct mix, skew, one-second arrivals, attempts, and logical work.
- Draw serial and parallel edges; mark optional semantics separately from wait behavior.
- Instrument time before spans: admission, executor, connection, and dependency queues.
- Compare service time with client-observed wait.
- Measure work continuing after deadline or cancellation.
- Treat fan-out probability as a scoped model, not a percentile sum.
- Test capacity at the resource owning the constrained queue.
- Charge retries, hedges, coalesced followers, and recovery work explicitly.
- Propagate remaining time while preserving side-effect semantics.
- Bound concurrency before the scarce queue and partition it where skew matters.
- Give caches and coalescing explicit identity, freshness, authorization, and failure rules.
- Validate peak, dependency slowdown, and recovery with correctness guardrails.
- Roll out one causal mechanism at a time with exemplars and abort conditions.
- Record transfer limits and production revisit triggers.
This case restored a modeled objective by removing one serial boundary, reducing duplicate profile work, assigning ownership of time, bounding admission, and making optionality real. The decisive result was not “p99 fell approximately 45%.” It was that the before/after evidence matched a causal model across peak, slowdown, and recovery while core correctness remained intact.
The next case changes the governing constraint. Chapter 67 introduces multi-region ordering and payment, where distance, authority, and failure semantics can make the lowest-latency local action the wrong global decision.