Performance Engineering and System Design Handbook / Chapter 71
Case Study: Multi-Tenant Interactive Analytics
Turn mixed analytics demand into tenant-aware admission, fair scheduling, bounded sharing, query budgets, and failure-tested performance promises.
Preparing audio…
Audio edition
Case Study: Multi-Tenant Interactive Analytics
At 09:07 on Monday, Aster’s operations review could not open its revenue dashboard. The first two tiles rendered in less than a second. The cohort and renewal tiles remained behind spinning indicators for eight seconds. A retry returned quickly, which made the failure look intermittent.
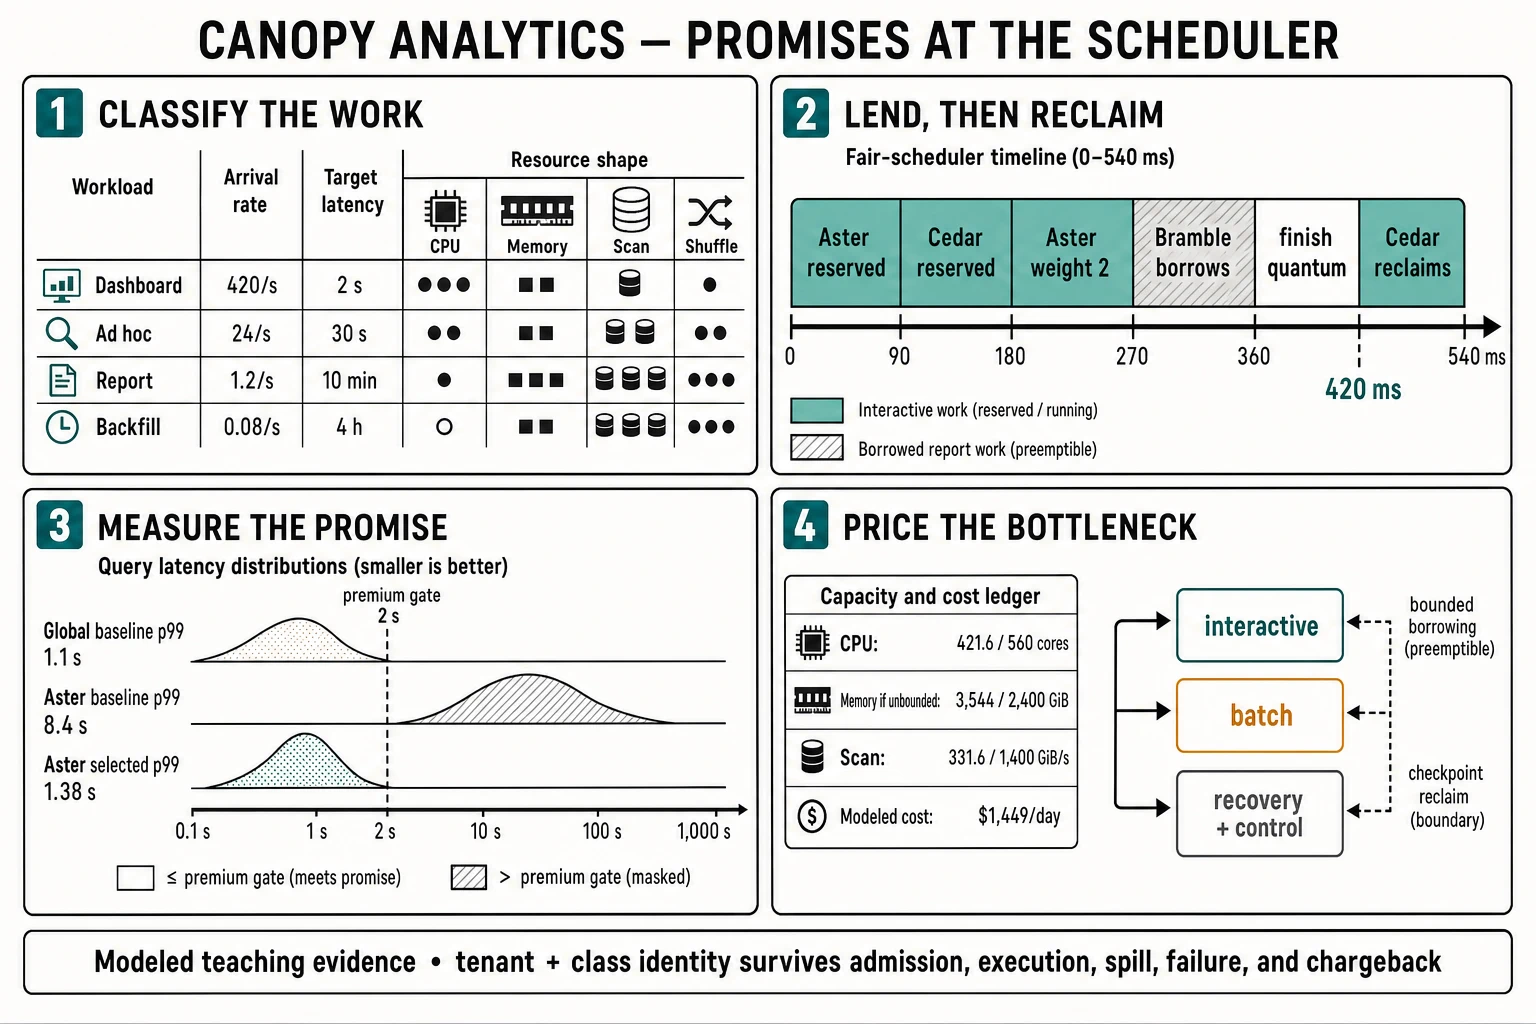
The platform dashboard was green. Across all dashboard queries, p99 was 1.1 seconds against a two-second premium objective. CPU used 53% of installed cores. Scan throughput used less than one quarter of its safe envelope. No worker had failed, and the completion counter was steady.
Aster’s own dashboard-query p99 was 8.4 seconds.
This is not a percentile paradox. The service made a promise to a tenant and evaluated it over a request-weighted fleet population. Aster contributed 8,000 of the fixture’s one million dashboard queries. Its 2,000 slow queries occupied only 0.2% of the global population, so the global 99th-percentile rank remained inside the 1.1-second bucket. The dashboard proved that most queries were healthy. It did not prove that each premium tenant received its promised service.
The architecture review begins with incomplete requirements:
- dashboards should feel interactive;
- analysts must retain unrestricted SQL;
- scheduled reports should finish before the business day;
- backfills should use idle capacity;
- premium tenants should be “prioritized”; and
- shared infrastructure should stay efficient.
Every phrase conceals a decision. Does interactive mean first row, complete result, or every tile? Is unrestricted SQL also unbounded work? What minimum can premium tenants claim, and over what interval? How soon must borrowed capacity return? Does a report remain useful after its deadline? Which spill and retry costs belong to the query that caused them? What must survive the loss of half the batch pool?
Canopy Analytics is the fictional system used to answer those questions. Every numerical result in this case is modeled or simulated teaching evidence from the companion packet. It is not a benchmark of Trino, Spark, an object store, a columnar format, or any commercial warehouse.
The design lesson is: efficient shared infrastructure requires explicit scheduling and isolation at the boundary where promises are made.
Reconstruct the work before changing the cluster
The useful completion unit is one admitted query that returns a correct result before its class deadline under the tenant policy it started with. A cached response counts only if its data generation, authorization, and query semantics remain valid. A rejected query is not a successful query, although parsing, authorization, classification, and rejection still consume work. A retried execution is another physical attempt attached to the same logical query identity.
The modeled boundary begins at edge admission and ends at a complete result or a typed rejection. It includes coordinator wait, planning, metadata access, worker queueing, scan, exchange, join, aggregation, spill, result assembly, and client-visible completion. It excludes client think time and data-production delay before the queried snapshot. The observation interval is a warm regional weekday peak lasting fifteen minutes.
Canopy carries tenant, workspace, workload class, query identity, deadline, data snapshot, policy generation, and cost-center identity through every stage. Those fields do not make a query cheap. They make its promise and consequences attributable.
The four workload classes look similar only when counted as queries:
| Class | Arrival rate | Deadline | Modeled demand per query | Completion contract |
|---|---|---|---|---|
| dashboard | 420/s | 2 s | 0.38 CPU-core-s; 0.18 GiB scan; 0.04 GiB shuffle; 0.25 GiB peak memory | all policy-valid tiles for one snapshot |
| ad hoc | 24/s | 30 s | 5.5 CPU-core-s; 7 GiB scan; 2 GiB shuffle; 1 GiB spill; 4 GiB peak memory | complete result or explicit budget rejection |
| scheduled report | 1.2/s | 10 min | 55 CPU-core-s; 40 GiB scan; 12 GiB shuffle; 8 GiB spill; 8 GiB peak memory | versioned report artifact by deadline |
| backfill | 0.08/s | 4 h | 800 CPU-core-s; 500 GiB scan; 120 GiB shuffle; 80 GiB spill; 16 GiB peak memory | checkpointed output for a declared data range |
The rates are irregular on purpose. Query count is not conserved resource demand. Dashboards dominate arrivals but not every resource. Backfills are 0.018% of queries and still demand 64 CPU-core-s/s, 40 GiB/s of scan, and long-lived memory when allowed to run. Scheduled reports and backfills tolerate wall-clock delay, but their large, non-preemptible stages can block work whose usefulness expires in seconds.
The first production hypothesis was “the cluster needs more CPU.” It was plausible because the slow spans contained CPU-heavy joins. The capacity packet rejects it as the primary explanation.
The cluster has 800 installed cores and 3,200 GiB of query memory. Canopy deliberately protects CPU at 70%, memory at 75%, and scan at 70%, giving safe envelopes of 560 cores, 2,400 GiB, and 1,400 GiB/s. The class arithmetic is:
CPU demand
  dashboards       420/s ×   0.38 core-s = 159.6 cores
  ad hoc            24/s ×   5.50 core-s = 132.0 cores
  reports          1.2/s ×  55.00 core-s =  66.0 cores
  backfills       0.08/s × 800.00 core-s =  64.0 cores
  total                                      421.6 cores

scan demand
  dashboards       420/s ×   0.18 GiB =  75.6 GiB/s
  ad hoc            24/s ×   7.00 GiB = 168.0 GiB/s
  reports          1.2/s ×  40.00 GiB =  48.0 GiB/s
  backfills       0.08/s × 500.00 GiB =  40.0 GiB/s
  total                                     331.6 GiB/s
CPU consumes 75.3% of its safe envelope. Scan consumes 23.7%. Neither proves abundant capacity: averages conceal worker, tenant, partition, and time concentration. They do show that fleet-wide CPU and scan purchases cannot be the first causal answer.
Memory exposes the harder constraint. Approximate unconstrained live memory as arrival rate multiplied by mean duration and per-query peak memory. Dashboards contribute 88.2 GiB. Ad hoc queries, reports, and backfills each contribute 1,152 GiB under their declared mean durations. The total is 3,544.2 GiB against a 2,400 GiB safe envelope. The equality among the last three classes is a teaching-fixture coincidence, not a general pattern.
That calculation is not a prediction of instantaneous residency; peak memory and mean duration are crude inputs. It is a discriminating bound. A policy that admits every class independently can ask the cluster to hold more query state than the safe memory envelope even while average CPU and scan look comfortable. Queueing, spill, allocation failure, and reclaim become the likely causal path.
The same inputs expose concurrency. Under a stable approximation, dashboards average 420/s × 0.84 s = 352.8 live queries. Ad hoc work averages 288, reports 144, and backfills 72. Those counts do not say where the queries wait, and the system is not truly steady during a burst. They do reveal why a hard limit of “500 concurrent queries” is meaningless without class and resource shape: 500 dashboards fit a very different memory and fragment envelope from 500 reports.
Canopy gives each class a deadline decomposition rather than one engine timeout. A dashboard’s two seconds reserve time for edge admission, planning and metadata, worker dispatch, execution, result assembly, and variance. The scheduler may move reserve between stages for an individual request, but every child receives the same absolute deadline. A worker does not reset a fresh two seconds when a fragment finally leaves the coordinator queue.
Ad hoc queries use a 30-second complete-result deadline and receive an earlier admission cutoff. If the estimate cannot leave execution and assembly reserve, the service asks for a partition filter, smaller output, approved aggregate, or durable job. Reports and backfills use artifact deadlines, not interactive timeouts. Their durable records include target snapshot, expiry, checkpoint identity, output location, and the consequence of lateness. A report that finishes after the regulatory handoff is not goodput merely because the engine says FINISHED.
Output is a resource as well. An unbounded result can hold coordinator memory, network buffers, client connections, and serialization CPU after scan and join complete. Dashboard templates have row and byte contracts. Ad hoc queries receive a preview or pagination policy whose ordering and snapshot semantics are explicit. Reports write a versioned artifact rather than streaming an unlimited response through an interactive connection. Backfills commit partitions with idempotent identities and a manifest, so retry does not double-publish a range.
These contracts create useful exclusions. “Unrestricted SQL” means the language remains expressive; it does not promise unbounded resource use or an interactive deadline for every valid statement. “Uses idle capacity” means batch may borrow under a reclaim rule; it does not make installed but reserved capacity free. “Premium priority” means a measurable reservation and weighted share, not permission to bypass correctness, security, or hard safety limits.
The aggregate hid the tenant and the query class
Canopy’s one-million-query baseline has 970,000 dashboard completions by 0.8 seconds, another 22,000 by 1.1 seconds, and 8,000 by 8.4 seconds. The global p99 rank is query 990,000, so it lands at 1.1 seconds. Aster has 8,000 dashboard queries: 6,000 complete by 0.8 seconds and 2,000 by 8.4 seconds. Its p99 lands in the slow bucket.
The same masking occurred at three other levels:
- class masking: dashboards and backfills were combined in “query duration,” making the distribution useless for either deadline;
- stage masking: worker service time excluded coordinator and memory-admission wait, so a fast scan looked like a fast query;
- success masking: client-abandoned queries were missing from the completion histogram, improving the apparent tail as harm increased.
Canopy changes the primary views to tenant tier × tenant × workload class × region × outcome. It retains bounded high-cardinality exemplars for diagnosis rather than placing raw tenant or query text in every metrics label. The operating board shows request-weighted global health, worst-tenants, tenant-percentile distributions, SLO attainment by class, queue age, delivered reservation, borrowed share, spill, rejection, and cost coverage.
The board also separates offered work, admitted work, running work, completed goodput, rejected queries, cancelled attempts, and late completions. A scheduler can make admitted p99 look excellent by rejecting half of demand. The admission outcome is therefore part of the service evidence.
The slow Aster traces revealed the sequence:
- a scheduled report borrowed idle interactive memory;
- its join build side exceeded the estimate and crossed the spill threshold;
- the engine began writing and rereading temporary partitions on workers shared with Aster;
- Aster’s dashboard fragments entered a global worker queue behind large scan and join tasks;
- one skewed customer partition became the final fragment on several dashboard queries; and
- client retries created duplicate planning and metadata work before the original attempts released resources.
Object-store latency rose in the same window, but slowing it in replay did not reproduce the 8.4-second mode unless the global memory queue and skewed partition were present. That was the failed hypothesis the review needed. The discriminating evidence was coordinator wait plus worker admission wait, spill bytes, per-partition rows, and cancellation-to-resource-release time—not CPU utilization.
Put the promise into admission and queues
The selected policy does not let a query enter a global FIFO and hope that downstream fairness appears. Admission first identifies the tenant and class, then estimates a resource vector:
query estimate = {
  cpu_core_seconds,
  peak_memory_gib,
  scan_gib,
  shuffle_gib,
  spill_risk_gib,
  worker_fragments,
  metadata_operations,
  deadline,
  snapshot_and_policy_generation
}
Estimates come from the normalized query shape, plan features, table and partition statistics, recent observations for the template, and conservative unknown-query defaults. Callers cannot buy a cheap lane by declaring their own cost. The service records predicted and observed demand, corrects template estimates, and expires a template’s evidence when schema, statistics, engine version, or plan shape changes.
Admission can produce five outcomes:
- admit now into a class and tenant reservation;
- admit queued when the maximum queue age still leaves execution reserve;
- require refinement because scan, join, or output bounds are missing;
- defer a scheduled or backfill query to a durable batch contract; or
- reject with a stable budget or capacity reason before expensive execution.
Every queue has a maximum count, estimated resource sum, and age. Count alone allows ten huge queries to look safer than one hundred small ones. Resource sum alone can let many tiny planning requests exhaust coordinator memory or metadata connections. Both are bounded.
Queued work is revalidated before dispatch. Its deadline may have expired, its data snapshot may no longer be eligible, or its plan evidence may have been invalidated. Canopy does not start a two-second dashboard after 1.9 seconds of queueing and then report a worker timeout as the cause.
Strict priority is rejected. It would protect dashboards during a short incident but could starve reports indefinitely under sustained interactive demand. Pure first-in-first-out is rejected because a backfill fragment can hold the head of line. Earliest deadline first is insufficient because a query that cannot finish can consume the very capacity needed by feasible work. Shortest predicted query first improves mean time but can punish tenants whose valid work is inherently larger.
The scheduler therefore applies feasibility, hierarchy, and aging:
- preserve control and recovery capacity;
- allocate tenant reservations for eligible demand;
- allocate class reservations inside each tenant;
- distribute idle borrowable capacity by weights and corrected cost;
- choose feasible work by deadline and age within that share;
- stop admission when memory, fragment, or downstream budgets cannot close; and
- age batch work toward a guaranteed service quantum.
Weights distribute contested excess; they do not replace reservations. A premium weight of two does not mean every Aster query runs before every Cedar query. It means Aster receives twice the eligible borrow share at the relevant hierarchy when both have demand, after minimums and hard limits.
The figure’s trace makes revocation concrete. Aster and Cedar first consume reserved interactive quanta. Aster receives a weighted borrow turn. Bramble’s report borrows an idle interactive turn at 270 ms. A Cedar arrival at 360 ms does not corrupt or kill a join in the middle of an unsafe operation. Bramble finishes a bounded quantum and checkpoints sufficient progress; Cedar reclaims its reservation at 420 ms. “Preemptible” means reclaimable at a proved boundary, not instantaneously interruptible.
Separate pools without stranding every idle unit
Canopy divides the safe envelope, not the installed inventory:
| Pool | CPU | memory | Primary work | Borrow rule |
|---|---|---|---|---|
| interactive | 360 cores | 1,200 GiB | dashboards and admitted ad hoc | lends bounded quanta while queue age is low |
| batch | 140 cores | 900 GiB | reports and backfills | accepts interactive overflow only under explicit incident policy |
| recovery and control | 60 cores | 300 GiB | health, fencing, metadata repair, checkpoint replay | never ordinary borrowable capacity |
The totals close at 560 cores and 2,400 GiB. Scan, network, temporary storage, metadata concurrency, and object-store request rate receive corresponding controls even though the fixture does not collapse them into the pool table. A CPU reservation without I/O and memory enforcement can still violate the promise.
Interactive and batch execution use separate worker groups and local spill budgets. They may share immutable data, metadata authority, and object storage, so the separation is not a security or total-failure boundary. The architecture inventory marks those dependencies explicitly. A batch pool can still raise interactive latency through a global catalog, storage prefix, encryption service, network link, or coordinator unless each dependency has a bounded class-aware path.
Borrowing is work-conserving but conditional:
- only checkpointable batch stages borrow interactive capacity;
- each borrowed quantum has a maximum service time and memory amount;
- interactive queue-age and reservation deficits stop new borrowing;
- reclaim waits only for the bounded safe point;
- borrowed spill is capped in its own local and remote namespace;
- batch retry cannot re-enter the interactive pool as “recovery”; and
- the recovery pool remains available to release locks, replay checkpoints, and restore scheduling authority.
A fixed physical split was rejected as the default. It protects interactive capacity simply, but strands large amounts overnight and can leave the report pool late during quiet periods. One completely shared pool was also rejected. It maximizes theoretical multiplexing while requiring every runtime and downstream queue to implement correct multi-resource fairness. The selected arrangement is a hybrid: enforceable pool boundaries plus bounded, observable borrowing.
The broader fairness literature matters here. Dominant Resource Fairness develops a multi-resource allocation mechanism and desirable fairness properties. Canopy borrows its discipline of examining dominant resource share; it does not claim those theoretical properties for deadline-bearing, locality-sensitive, stateful queries with indivisible tasks. Trino resource groups document queue limits, soft and hard concurrency, memory, CPU limits, selectors, weights, and scheduling policies in a current implementation. Spark’s fair scheduler documents pools, weights, and minimum shares. Those are implementation references, not evidence that either product enforces Canopy’s end-to-end tenant contract.
Treat spill, skew, and stragglers as scheduled work
Spill prevents some memory exhaustion by moving intermediate state to storage. It does not create free capacity. A spilled join spends serialization CPU, local or remote writes, reads, checksums, cache capacity, network, and longer memory lifetime. It can turn one query’s memory overrun into every tenant’s I/O tail.
Canopy sets spill policy before execution:
- dashboards do not spill silently; they receive a smaller bounded plan, a valid pre-aggregation, or an explicit rejection;
- ad hoc queries may spill up to a query and tenant budget when the remaining deadline can still close;
- reports and backfills may spill in the batch pool with byte, rate, and temporary-retention limits;
- spill bytes are charged to the causal query and tenant;
- spill cleanup is idempotent and survives coordinator failure; and
- cleanup and replay use recovery capacity rather than competing as untagged background work.
An unlimited spill fallback was rejected. It converts a predictable memory refusal into an unpredictable storage incident. A no-spill policy was also rejected for batch: some correct, valuable jobs can finish economically with bounded external state.
Skew requires plan evidence. Average rows per partition do not predict the last task when one tenant, customer, day, or null key dominates. Canopy records input rows and bytes, output rows, service time, wait, peak memory, shuffle, and spill by bounded partition-size bucket. It samples partition fingerprints in an access-controlled diagnostic stream without exporting raw sensitive keys to general metrics.
The Aster case joins a compact entitlement table to events by account_id. The planner’s build-side estimate is accurate globally. One premium workspace has a single account holding 31% of the selected event rows, so the probe side concentrates on one fragment. Adding workers does not split that key and can increase shuffle fan-out.
The repair sequence is conditional:
- filter and project before shuffle so irrelevant bytes never enter the join;
- pre-aggregate by the final grouping key when semantics permit;
- broadcast only a build side whose bytes, version, and per-worker memory fit under the class budget;
- salt or range-split a hot key only with a correct second-stage combine;
- isolate exceptional tenants or templates when their distribution is stable and material; and
- update statistics and invalidate learned budgets after the shape changes.
Speculative execution can reduce a final-task tail, but only after enough progress exists to identify a straggler and only when duplicate work has spare capacity. The original MapReduce paper describes backup tasks and their observed benefit in its environment; it also makes duplicate work visible. See MapReduce: Simplified Data Processing on Large Clusters. Canopy never speculates a memory-bound fragment onto another saturated worker or launches duplicate external side effects without an identity and winner rule.
The Tail at Scale explains how component variability becomes user-visible at fan-out. It supports the need to control stragglers and tails, not a universal instruction to hedge. Canopy’s first defenses are bounded fan-out, accurate partitioning, queue isolation, and cancellation. Speculation is a final, charged option for eligible fragments.
Expensive joins receive three budgets: estimated input and shuffle, peak build memory, and maximum fragment count. Query syntax is not the unit. A short SQL statement can request an unbounded cross join; a long generated statement can be well bounded by partitions and keys. Admission inspects the physical plan and uncertainty.
Attribute the cost that the query actually caused
Chargeback is an operating model, not an invoice copied from one resource counter. Canopy retains raw CPU-core-seconds, memory-GiB-seconds, scan, shuffle, spill, network, and metadata work. It then applies a versioned modeled rate card:
query cost =
    CPU-core-s       × $0.000012
  + scan GiB         × $0.000020
  + shuffle GiB      × $0.000030
  + spill GiB        × $0.000025
  + memory GiB-s     × $0.0000003
  + $0.0000008 fixed admitted-query overhead
These are teaching rates, not market prices. With the declared demands, one modeled dashboard costs $0.000010223, one ad hoc query $0.0003062, one report $0.0023088, and one backfill $0.0295208. Multiplied by the workload, the model produces about $1,449.33 per day.
The rate card separates four facts:
- physical demand: observed units at named boundaries;
- shared overhead: coordinator, control, reserve, and idle capacity allocated by an explicit policy;
- commercial price: the product decision about what a tenant pays; and
- budget: the permission to admit more work over an interval.
They should not be forced to equal one another. A tenant can be commercially free while still needing a physical limit. Failure reserve may be intentionally underutilized and still belongs in capacity economics. An estimated query may be rejected before spending its maximum budget.
Canopy enforces per-query, per-template, per-tenant-hour, and per-tenant-day budgets. A dashboard template has learned scan and memory ceilings. An analyst gets a preview showing estimated scanned bytes, join risk, and an uncertainty band. A report owner chooses whether a budget excess should fail, wait for a cheaper window, or use an approved aggregate. Backfills have a durable budget and expiry.
Observed cost corrects future admission but does not retroactively change a completed query’s policy generation. Chronic underestimation raises the safety factor and can quarantine a template. Chronic overestimation should also be corrected; otherwise safe queries are needlessly rejected and pooling efficiency decays.
Result caching does not automatically make an expensive query cheap. Canopy charges cache lookup and storage directly, attributes saved service demand as separate evidence, and keys results by query semantics, tenant authorization, snapshot, and policy-relevant state. A high hit rate that returns stale or cross-tenant results is not efficiency.
Prove fairness, starvation bounds, and recovery
The validation plan starts from outcomes, not scheduler counters. For each tenant and class, Canopy measures correct goodput, rejection, queue wait, service time, end-to-end distribution, delivered reservation, borrowed capacity, reclaim delay, spill, and attributed resource demand. It keeps global views for fleet operation but never substitutes them for tenant promises.
The fixture uses SLO-attainment fractions for four tenant/class populations. Baseline values are 0.91, 0.98, 0.99, and 0.72. Their Jain fairness index is about 0.9857. The selected values are 0.993, 0.988, 0.991, and 0.982, producing about 0.99998. Jain’s index compresses disparity; it does not prove that each SLO is good, identify the harmed tenant, or account for different contracts. Canopy therefore requires both the per-population gates and the aggregate fairness diagnostic.
The post-change modeled outcomes are:
| Measure | Baseline | Selected | Gate |
|---|---|---|---|
| global dashboard p99 | 1.1 s | 1.05 s | contextual, not contractual |
| Aster dashboard p99 | 8.4 s | 1.38 s | ≤ 2 s |
| cost-attribution coverage | incomplete | 99.7% | ≥ 99.5% |
| maximum batch wait | unbounded in peak replay | 172 s | ≤ 180 s |
| rejected before execution | untyped late failures | 0.3% typed | product-reviewed |
The 0.3% rejection fraction is not celebrated as a performance win. Reviewers inspect which tenants and classes were rejected, whether estimates were correct, and whether the product contract offered a useful refinement or durable deferral path.
Validation runs with an open-loop arrival schedule so a slow system does not reduce its own offered load. Queries use fixed snapshots and correctness reconciliation. The matrix includes steady peak, cold metadata, skewed tenant, spill threshold, slow storage, coordinator restart, worker loss, client cancellation, retry, and pool recovery. Each test records distributions rather than only averages.
Four trials are mandatory:
Reservation trial
Drive every tenant above demand while varying query shapes. Verify that eligible interactive reservations are delivered over their declared short interval, weights divide only borrowable excess, hard limits hold, and an underestimating tenant does not gain lasting share. Repeat with one downstream metadata queue constrained; edge-only fairness must not pass.
Starvation trial
Run sustained interactive load above its reservation while reports and backfills remain eligible. Verify that aging grants a batch quantum within 180 seconds, then verify that granting it does not break the premium p99. A starvation timer that dispatches an unbounded scan is not a solution; the quantum itself must be bounded.
Pool-loss and recovery trial
Remove half of the batch pool while borrowed work is active. Canopy stops new borrowing, preserves 99.8% of the interactive reservation against a 99.5% gate, replays at most 31 seconds of checkpointed batch work against a 45-second gate, and keeps post-failure Aster p99 at 1.74 seconds. Recovery capacity restores control and cleans spill before batch admission expands.
Cancellation and retry trial
Cancel dashboards at their client deadline and measure cancellation-to-release across coordinator, workers, exchange, storage, and spill. Send one bounded retry with the same logical identity. The original and retry may both consume attempts, but result assembly accepts one valid completion and all late state is reclaimed. A closed socket is not proof that a fragment stopped.
The pool-loss numbers are simulated outcomes, not availability claims. A real release needs hardware and engine versions, worker and storage topology, query corpus, warm/cold state, sample sizes, raw traces, correctness results, and repeated recovery runs.
Roll out a scheduler as a data migration
Scheduling policy changes who waits and who pays. Canopy treats it like a stateful migration.
First, shadow-classify queries and compare predicted with observed CPU, memory, scan, shuffle, spill, and duration. No dispatch changes occur. Unknown and unstable plans stay conservative. The team audits whether tenant and class identity reaches every expensive stage.
Second, create the pool hierarchy while leaving current dispatch authoritative. Mirror counters into a decision log: predicted class, selected queue, reservation, borrow, estimated cost, actual cost, and the action the new scheduler would have taken. Differences are reviewed by tenant and query class, not only fleet total.
Third, enforce hard safety bounds that do not reorder eligible work: maximum queue count, maximum queued estimated memory, query scan limit, fragment limit, spill limit, and typed rejection. This stage may expose callers that relied on accidental unbounded behavior; product and support paths need notice.
Fourth, enable reservations and bounded borrowing for a small tenant cohort. Advance through 1%, 5%, 20%, 50%, and 100% of eligible query traffic with hold periods covering business peaks and report windows. Gates include premium p99, per-tenant SLO attainment, rejection, batch maximum wait, cost coverage, spill, metadata latency, and recovery reserve.
Rollback restores the previous dispatch authority for new queries. Already running queries keep their starting policy identity and pool ownership. Rollback does not merge isolated spill namespaces, forget borrowed work, or delete decision evidence. If new queue semantics changed client responses, the compatibility layer remains until callers no longer depend on them.
The review rejected a one-step switch because the baseline did not contain enough tenant identity to attribute harm. It also rejected migration by tenant count; one large tenant can represent most resource demand. Cohorts are selected by demand and risk.
Assemble the design review packet
Decision. Classify dashboard, ad hoc, report, and backfill work before execution. Enforce tenant × class bounded queues. Divide the safe CPU and memory envelopes into interactive, batch, and recovery/control pools. Protect reservations, use weights for contested borrowing, reclaim at proved checkpoints, and age batch work to a bounded quantum. Budget scan, joins, fragments, spill, and cost. Preserve tenant and policy identity through every attempt.
Assumptions. The workload and safe fractions describe one warm regional weekday peak. Query-shape estimates are versioned and corrected. Interactive tasks can normally finish inside bounded quanta. Reports and backfills can checkpoint at selected stage boundaries. Shared metadata and object storage receive corresponding class-aware limits.
Evidence. The deterministic packet reproduces 445.28 queries/s, 421.6 safe-envelope cores of demand, 331.6 GiB/s scan, an unconstrained 3,544.2 GiB memory estimate, global 1.1-second versus Aster 8.4-second baseline p99, pool closure, a 420 ms reclaim point, modeled daily cost, fairness movement, and all tenant, starvation, attribution, and failure gates.
Rejected defaults. Global FIFO permits head-of-line blocking. Strict priority starves background work. Query-count quotas misprice heterogeneous work. Fixed physical pools strand capacity. Fully shared pools rely on incomplete downstream fairness. Unlimited spill transfers overload. Automatic speculation duplicates scarce work. Fleet p99 does not prove a tenant promise.
Failure behavior. Stop borrowing before reducing reservations. Cancel expired fragments and release state. Checkpoint eligible batch work. Keep recovery/control capacity unavailable to ordinary traffic. Restore interactive service before expanding batch admission. Reconcile spill and results after coordinator or worker loss.
Rollback. Restore previous admission authority for new queries, retain typed outcome compatibility, let or cancel existing queries under their starting generation, preserve pool and spill ownership until cleanup, and retain shadow evidence.
Revisit. Any premium tenant p99 exceeds two seconds; a tenant misses its delivered reservation; batch waits more than 180 seconds; estimated versus observed demand drifts materially; cost coverage falls below 99.5%; reclaim exceeds its bound; spill crosses pool limits; a downstream queue loses tenant identity; query mix changes by 15%; or the system changes engine, worker, storage, or plan semantics.
The review intentionally does not choose a query engine, storage format, or cloud service. Product features can implement parts of the policy, but no product name closes the workload model, shared-dependency inventory, failure reserve, and tenant evidence by itself.
Applied work
Field exercise: the green cluster and the red tenant
A new premium tenant, Elm, contributes 0.6% of dashboard queries. Global dashboard p99 is 1.3 seconds. Elm p99 is 6.2 seconds. CPU is 61% of the safe envelope, memory is 88%, and scan is 28%. Elm’s slow traces show 70% coordinator admission wait, 20% worker queue wait, and 10% service. A report pool is borrowing memory, but no CPU, from interactive workers. Reports checkpoint every 90 seconds. Interactive reclaim is promised within 500 ms.
Diagnose the highest-ranked failure and propose the next discriminating observation. Then state one safe immediate action and one redesign.
Answer guide
The highest-ranked failure is not CPU or scan shortage. Elm is masked globally and waits primarily before service. Memory borrowing with a 90-second checkpoint cannot satisfy a 500 ms reclaim promise; “borrowing memory only” still retains state and can block admission. Inspect delivered versus configured interactive memory reservation, borrowed-memory age, the exact safe reclaim boundary, queued estimated memory by tenant/class, and whether Elm’s plan estimates understate peak memory.
A safe immediate action is to stop new report borrowing, allow or explicitly cancel existing work at its next safe checkpoint, and reserve interactive admission while watching spill and recovery capacity. Killing workers blindly can multiply replay and cleanup. The redesign shortens or adds checkpointable report stages, separates report memory ownership, bounds borrowed quanta by reclaim time, and gates borrowing on interactive queue age. If reports cannot checkpoint within the contract, they cannot borrow that resource.
An alternative valid diagnosis is a tenant-specific estimator error if Elm alone underdeclares memory. Evidence would be predicted versus observed memory and plan shape. The common wrong turn is buying CPU because the slow query contains a CPU-heavy join. The trace already shows that service is only 10% of elapsed time.
Principal exercise: fairness after a skewed merger
Aster acquires a tenant whose nightly report now reads 48% of all customer rows. The report must finish within 20 minutes for a regulatory handoff. Premium dashboards must keep p99 below two seconds. The current report uses one hot join key, spills 600 GiB, and holds borrowed interactive memory for 40 seconds between safe points. Dedicated capacity would add 18% to the platform’s monthly infrastructure cost.
Design a policy and migration. Address partitioning, admission, pool placement, reservation, opportunistic sharing, spill, stragglers, cost attribution, failure recovery, and evidence. Explain when the 18% dedicated option becomes justified.
Answer guide
Begin by separating the regulatory report from ordinary scheduled work. Its deadline is real, but that does not make it interactive. Re-plan the hot key: pre-aggregate, split it with a correct second-stage combine, or isolate its exceptional partition. Validate build-side bytes before broadcast. Place the job in a batch cell with an explicit deadline reservation sized from CPU, memory, scan, shuffle, and spill—not one priority flag.
Do not allow 40-second borrowed interactive memory under a two-second dashboard promise. Either create shorter checkpointable stages, reserve enough batch memory to meet the report deadline without interactive borrowing, or allow only resources whose reclaim bound closes. Cap spill rate and bytes, preserve cleanup capacity, and attribute the acquisition’s incremental demand and dedicated reserve to the responsible cost center.
Replay the new distribution at steady peak, one worker slow, half batch pool lost, storage degraded, and checkpoint restore. Measure dashboard p99 per tenant, report completion distribution, reservation delivery, reclaim, spill, scan, and correct output reconciliation. Migrate with shadow estimates, then a demand-sized cohort.
Dedicated capacity becomes justified when an identified constraint cannot be safely scheduled in the shared pool: the indivisible hot key, incompatible security or data rule, a required reservation that would consume most shared failure reserve, or repeated evidence that bounded sharing cannot meet both promises. The 18% cost is then compared with regulatory value and shared-pool displacement, not dismissed as low utilization. A correct alternative may use a dedicated report cell while keeping storage and metadata shared under explicit limits.
Field review card and source limits
When reviewing multi-tenant analytics, ask:
- What exact event starts and ends each class deadline?
- Are dashboards, ad hoc queries, reports, and backfills separate populations?
- Can global p99 be green while a small tenant violates its promise?
- Which resource vector is estimated before admission, and how is it corrected?
- What bounds queued count, resource sum, and age?
- Which resources are reserved, limited, weighted, and borrowable?
- At what proved boundary does borrowed work return capacity?
- Can spill or retry escape the tenant and class budget?
- Which join keys, partitions, or fragments dominate the tail?
- Does every downstream queue preserve tenant and class identity?
- Is cost reported per successful logical query with attempts and shared overhead visible?
- What prevents strict priority from starving reports and backfills?
- What remains available to checkpoint, fence, clean spill, and recover?
- Does the load test keep offered load fixed and reconcile correctness?
- Can rollback preserve the policy identity of work already running?
The primary sources establish mechanisms and implementation examples, not Canopy’s numbers. DRF analyzes multi-resource fairness under its model. Trino and Spark document concrete resource-group and fair-pool controls as of the versions served by their current documentation. MapReduce and The Tail at Scale explain straggler and fan-out mechanisms in their environments. None proves that a particular analytics engine, storage system, or query corpus will reproduce the fixture’s latency, fairness, spill, or cost outcomes.
Run the evidence packet:
cd examples/performance-engineering-system-design-handbook/part-08/multi-tenant-interactive-analytics
node analyze.mjs
node verify.mjs
The packet is deliberately smaller than a scheduler simulator. It checks arithmetic and decision gates. Production validation needs real query plans, fixed data snapshots, tenant distributions, raw latency and resource samples, worker and storage topology, engine version, open-loop replay, correctness reconciliation, and repeated degraded-state trials.
Canopy’s selected architecture is not “fair” because it has weights, and it is not “isolated” because it has pools. It is defensible because the tenant promise appears in the measurement population, admission record, queue hierarchy, resource ownership, borrow and reclaim rules, cost ledger, and failure test. Carry that discipline into accelerator serving: one request count can hide not only CPU, memory, and deadline differences but also iterative output work and quality value.