Performance Engineering and System Design Handbook / Chapter 59
The Optimization Workflow: From Hypothesis to Durable Gain
Choose performance work by bounded end-to-end value, prove its causal effect, expose displaced cost, and retain only gains that survive production.
Preparing audio…
Audio edition
The Optimization Workflow: From Hypothesis to Durable Gain
Which two of ten plausible optimizations deserve the next two engineer-weeks?
Mercury’s customer-read API has recovered from the retry-amplified incident in Chapter 58, but its region A interactive cohort still reports a 420 ms p99 against a 350 ms objective. A profile makes codec work conspicuous. A query plan suggests an index. An application engineer proposes batching two enrichment calls. A platform engineer wants more replicas. Every proposal can produce a faster number somewhere; only some can remove enough time from the declared user path to matter.
This is the optimization problem senior engineers actually own. The scarce resource is not CPU cycles but engineering attention under uncertainty. A defensible workflow moves from objective to baseline, decomposition, upper bound, causal test, workload envelope, and production transfer. It also asks what cost moved elsewhere and whether the gain will remain after the author leaves.
The controlling rule is: optimize only when the bounded end-to-end benefit, evidence quality, and durability justify complexity and opportunity cost. A locally impressive result can fail that rule before implementation. A production improvement can fail it afterward.
Use this workflow when a performance objective is missed, a profiler or experiment produces several plausible targets, a team must choose among competing improvements, or a local win needs an end-to-end production claim. It is deliberately too expensive for a deterministic one-line repair whose mechanism and blast radius are already established.
By the end, you should be able to:
- convert a user or economic objective into a reproducible optimization boundary;
- calculate an end-to-end upper bound before approving implementation;
- distinguish causal effect from sampling uncertainty and displaced cost;
- design envelope and production-transfer checks with explicit stop conditions; and
- decide when cleanup, deferral, or no optimization has higher return than another faster number.
Start with the result that must change
“Reduce latency” is not an objective. Mercury’s record is narrower:
Capability: customer-read API, region A, interactive traffic
Unit: one logical customer read; attempts reported separately
Population: standard payloads, warm steady state, versions 7.19–7.20
Current: 420 ms p99; 7,700 correct completions/min inside 750 ms
Target: <=350 ms p99 while goodput remains >=7,600/min
Guardrails: correctness, authorization freshness, CPU, memory, dependency load
Economic boundary: ten engineer-days; no new managed service this cycle
Evidence: simulated repeated production windows plus deterministic packet
The 70 ms gap is the minimum useful opportunity. Work can still be worthwhile for cost, capacity, energy, or reliability, but then it needs that objective explicitly. Optimizing CPU while the decision is deadline goodput is a category error unless CPU causally constrains that goodput.
Choose one primary result and guard it with secondary measures. Multiple primary objectives invite retrospective success: latency misses, so the team celebrates CPU; CPU rises, so it celebrates throughput. Mercury will judge the candidate by cohort p99 and goodput, then inspect correctness, resource demand, cold behavior, and cost.
Reproduce the workload before explaining it
A baseline is a rerunnable claim, not a screenshot. Preserve request mix, keys and tenant skew, payload distribution, cache state, concurrency, arrival process, dependency versions, data statistics, topology, build, flags, and measurement windows. Separate warm steady state from startup and recovery. Record rejected, late, retried, and failed work so a faster successful subset cannot masquerade as improvement.
Mercury uses eight paired control/candidate windows with the same routing stratum. The control p99 observations average 420.875 ms; candidate windows later average 338.5 ms. That comparison becomes meaningful only after checking population balance, missing telemetry, correctness, and interference. It is not permission to average arbitrary percentiles across hosts. The fixture stores the already aggregated, matched teaching windows; a real record must retain raw distributions and experimental units.
If the incident workload cannot be reproduced, narrow the claim. A trace replay may reproduce request shapes but not shared dependency contention. A synthetic generator may control arrivals but miss tenant correlations. A shadow may preserve production inputs while omitting write effects. State these transfer limits before accepting a baseline.
Decompose cost without inventing causality
For the selected slow cohort, Mercury’s scoped model assigns 420 ms across the critical path:
| component | modeled contribution | evidence to strengthen it |
|---|---|---|
| edge and routing | 24 ms | matched ingress spans and network probes |
| application work | 32 ms | on/off-CPU profile plus spans |
| authorization | 28 ms | cache-hit strata and freshness checks |
| primary database | 86 ms | trace, wait evidence, plan, rows, buffers |
| two serialized enrichment calls | 120 ms | child spans and call-count identity |
| serialization | 6 ms | allocation and codec benchmark |
| queueing | 74 ms | queue age and concurrency state |
| residual network/wait | 50 ms | hop timing with clock caveat |
These contributions belong to one modeled cohort; they are not independently sampled percentiles added together. Parallel branches contribute through the critical branch, shared waiting can be double-counted, tracing adds overhead, and uninstrumented gaps remain residual. Reconcile the model to end-to-end elapsed time, label inference, and attack the largest uncertainty before the largest bar when uncertainty could reorder the decision.
Profiles answer where sampled execution occurred. Traces answer how a request moved. Query plans explain one database execution strategy. None alone proves which change improves the objective. PostgreSQL, for example, documents that planner costs use arbitrary units, statistics and platform affect estimates, and EXPLAIN ANALYZE actually executes the statement. Use plan nodes, row estimates versus actuals, loops, buffers, and scoped execution evidence—not a screenshot of “cost.”
Bound the prize before building
If a component contributes fraction f of relevant elapsed work and a change speeds that component by factor s, the idealized total speedup is:
S_total <= 1 / ((1 − f) + f / s)
This is the familiar bounded-speedup reasoning from Amdahl’s 1967 argument. It is useful precisely because it is unforgiving: unaffected work remains. It is not a latency law. Queue interactions, parallel branches, cache state, and changed resource contention can make the system nonlinear.
Mercury needs 70 ms. Batching can remove at most 60% of the 120 ms enrichment contribution, a 72 ms ceiling. The proposal is barely large enough before accounting for displaced work. The codec benchmark reports 31% lower time in a component contributing only 6 ms. Even perfect transfer saves at most 1.86 ms—2.66% of the required gap. Reject it for this objective without disputing the benchmark.
This pre-implementation bound prevents three expensive mistakes:
- converting a hotspot percentage into end-to-end improvement;
- applying a microbenchmark ratio to work outside the measured component; and
- implementing a change whose theoretical ceiling cannot cross the decision threshold.
Rank hypotheses by value of information
Ten proposals compete in the packet. The ordering below combines bounded impact, current evidence, durability, risk, and test effort. The numeric score in the fixture is a transparent triage heuristic, not an organizational truth.
| priority | proposal | ceiling | test effort | decisive next evidence | disposition |
|---|---|---|---|---|---|
| 1 | batch serialized enrichment | 72.0 ms | 5 d | call-count trace and failure semantics | fund bounded experiment |
| 2 | deadline-aware admission | 29.6 ms | 3 d | open-loop overload run | retain as complementary control |
| 3 | customer lookup index | 37.84 ms | 4 d | representative plans/data statistics | test only after evidence gap closes |
| 4 | more frontend replicas | 18.5 ms | 3 d | service-demand and dependency headroom | capacity option, not first fix |
| 5 | payload compression | 10.0 ms | 4 d | payload strata and CPU/network trade | defer |
| 6 | codec microbenchmark | 1.86 ms | 2 d | none needed for this objective | reject |
| 7 | authorization cache | 18.2 ms | 6 d | revocation/freshness correctness | reject current risk |
| 8 | larger database pool | 8.4 ms | 2 d | waits and saturation by pool state | reject weak mechanism |
| 9 | runtime upgrade | 6.84 ms | 7 d | matched application benchmark | schedule separately |
| 10 | asynchronous audit log | 0 ms on measured path | 4 d | verify trace placement | reject premise |
High uncertainty does not always mean “do nothing.” It may mean buy a cheap discriminating measurement. A one-day trace improvement that prevents a six-day authorization-cache experiment has high return even if it changes no production metric.
Change one mechanism and predict its signatures
The funded hypothesis is: two serialized enrichment calls dominate 120 ms; one batched call will remove a round trip and reduce queue pressure without changing response semantics.
Write predictions before implementation:
Primary: matched candidate p99 falls by at least 70 ms and below 350 ms
Mechanism: enrichment calls/read 2 -> 1; enrichment contribution 120 -> <=50 ms
Secondary: queue contribution falls as in-flight dependency work falls
Displaced cost: application CPU and memory may rise; warm-up may lengthen
Correctness: fields, omission markers, authorization, freshness remain equivalent
Failure: batch partial failure obeys the existing optional-enrichment contract
Falsifier: end-to-end changes without call-count/contribution movement
Keep the mechanism separable when possible. Do not combine batching, a new cache, runtime upgrade, and pool change in one candidate. If two changes must travel together for correctness, treat the bundle as the intervention and admit that attribution is coarser.
Measure effect, uncertainty, and displaced cost
The modeled after-state totals 332 ms: enrichment falls from 120 to 48 ms and queueing from 74 to 56 ms, while application work rises from 32 to 34 ms. The model predicts an 88 ms, 20.95% improvement. Paired production windows observe an 82.375 ms mean p99 difference and a declared 79–85 ms interval in the teaching packet. The candidate reaches 338.5 ms mean p99 and 8,420 good completions/min.
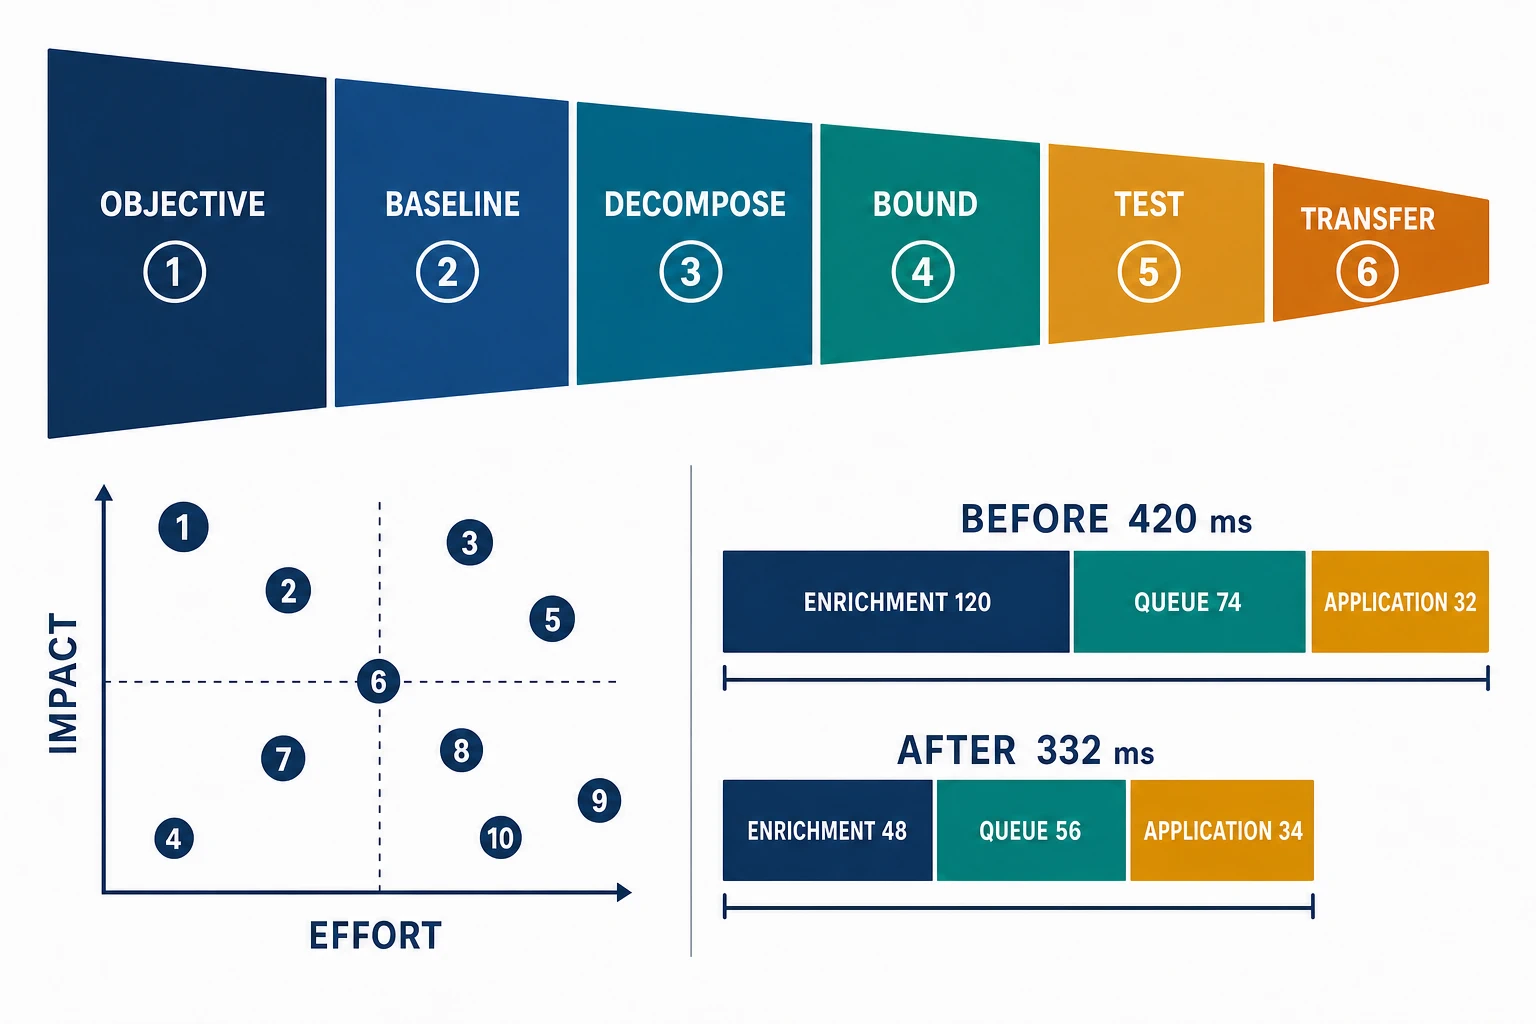
The gain is not free:
- CPU demand rises from 28.0 to 31.5 ms/operation, or 12.5%;
- memory rises from 4.8 to 6.1 GiB/instance;
- warm-up rises from 90 to 210 seconds; and
- dependency calls fall from two to one.
An optimization usually exchanges resources, time, failure behavior, or human complexity. Measure the displaced quantity in the same experimental windows. Otherwise the system may look faster because it moved work to a downstream service, a later queue, a cache refill, a retry path, or an operator.
Confidence intervals quantify sampling uncertainty under their assumptions; they do not correct biased cohorts, shared interference, clock error, or a changed request mix. NIST’s confidence-interval guidance makes the repeated-sampling interpretation explicit. Choose the experimental unit and method before seeing the result, and pair statistical detectability with a practical threshold.
Make the gain survive the workload envelope
Repeat the test across the states where the mechanism can reverse:
| envelope axis | required comparison | likely reversal |
|---|---|---|
| payload and batch size | small, median, large, maximum legal | batching overhead dominates small work |
| key/tenant skew | representative and hot tenant | one batch amplifies a hot partition |
| cold/warm state | empty and steady caches | 210 s warm-up erases capacity |
| concurrency | low through overload | larger batch queue or pool saturation |
| dependency behavior | normal, slow, partial error | correlated batch failure enlarges blast radius |
| recovery | restart, failover, backlog drain | cache fill and reconnection displace foreground work |
Check correctness at every point. Faster partial responses, stale authorization, reordered fields, dropped audit effects, or changed retry identity are not gains. Inspect security: batching may expose cross-tenant identifiers or create broader authorization decisions. Inspect operations: can on-call distinguish batch size, partial failure, warm state, and dependency load without cardinality explosion?
Transfer through production without declaring victory early
A lab result becomes a production claim through a matched, time-bounded rollout. Canary and control should have comparable traffic, topology, warm state, dependencies, and telemetry. Google SRE’s canary guidance defines a canary as partial and time-limited change evaluation; it also warns that real traffic reveals defects artificial tests miss.
Mercury transfers in steps: one isolated cohort, 5%, 20%, then 50%, with hold windows long enough to cover warm-up and a peak period. Stop on correctness divergence, p99 above 350 ms after warm state, goodput below 7,600/min, dependency error/load breach, memory pressure, or rollback impairment. Record assignment and interference; a shared dependency can contaminate the control.
Chapter 60 will turn those boundaries into a rollout system. For this chapter, the important distinction is that “candidate passed a microbenchmark,” “candidate passed representative load,” and “candidate transferred to production” are different evidence states.
Preserve the gain by removing its scaffolding
After the observation window:
- update the workload and cost decomposition with the observed after-state;
- convert the objective and displaced-cost limits into regression checks;
- remove the old per-item call path when rollback policy allows;
- expire the feature flag, shadow comparison, temporary metric, and repair queue;
- delete obsolete pool tuning or workarounds made unnecessary by batching;
- document ownership for the larger memory footprint and slower warm-up; and
- record what evidence would invalidate the decision.
Permanent dual paths double maintenance and test surface. A feature flag without expiry preserves ambiguity. A cache without an invalidation owner creates a future incident. “Keep it just in case” is a cost that belongs in the optimization record.
Know when to stop
Do not optimize when the objective is already met with healthy headroom; the baseline is not reproducible; the theoretical ceiling is immaterial; correctness risk dominates; a simpler product or workload change produces more value; the result will not survive the expected envelope; or maintenance exceeds the benefit.
Also stop at the economic frontier. The first 82 ms may cost ten engineer-days; the next 3 ms may cost a quarter and add a proprietary subsystem. Opportunity cost is part of system performance because it determines which reliability, security, and product work does not happen.
The workflow itself can fail. Teams can turn the record into an approval ritual, rank proposals with invented precision, keep measuring to avoid a decision, or demand single-mechanism purity from changes that are inseparable for correctness. The repair is not less rigor but sharper gates: name the uncertainty that could change the decision, buy only that evidence, give one owner authority to stop, and time-box exploration before the next portfolio review.
Optimization record
Use one record through proposal, experiment, rollout, and cleanup:
OPTIMIZATION RECORD
Objective/population/unit: __________________________________________
Baseline + reproduction path: ______________________________________
Current result / required result: __________________________________
Decomposition and evidence gaps: ___________________________________
Hypothesis and causal mechanism: ___________________________________
Contribution / removable fraction / upper bound: ___________________
Predicted primary, secondary, guardrail, and failure signatures: ____
Experimental unit, comparison, repetitions, warm-up, uncertainty: ___
Observed effect and practical threshold: ____________________________
Displaced CPU/memory/I/O/network/cost/complexity: ___________________
Envelope and failure states exercised: ______________________________
Production cohort, hold, success, abort, rollback: __________________
Security, maintainability, and operational consequences: ___________
Regression checks and model updates: ________________________________
Flags/dual paths/temporary telemetry to remove; owner/date: _________
Decision and evidence that would reverse it: ________________________
Applied work: spend ten days
Before spending the budget, answer this compact field check:
- Is the primary objective stated by population, unit, interval, state, and success?
- Can another engineer rerun the baseline with failures and missing work preserved?
- Does the decomposition reconcile to end-to-end time without adding unrelated percentiles?
- What fraction can the proposed mechanism actually remove, and is the ceiling material?
- Which cheapest evidence could reorder the proposal ranking?
- What causal signature, guardrail, and falsifier are written before the change?
- Which CPU, memory, I/O, network, downstream, correctness, security, and operator cost may move?
- Which skewed, cold, saturated, failed, and recovering states could reverse the result?
- Is production comparison matched, bounded, observable, and reversible?
- Which flag, dual path, workaround, metric, or model becomes obsolete after acceptance?
Run the packet:
cd examples/performance-engineering-system-design-handbook/part-07/optimization-workflow
node analyze.mjs
node verify.mjs
Then, without using the fixture’s score as authority:
- Rank all ten proposals by end-to-end ceiling, evidence gap, test cost, risk, and durability.
- Allocate ten engineer-days, including production transfer and cleanup—not only coding.
- Reject the codec win in writing: name its 6 ms boundary, 31% reduction, 1.86 ms ceiling, and 70 ms objective gap.
- Challenge the batching estimate under cold start, hot tenant, partial dependency failure, and maximum batch size.
- Complete the optimization record and name the first result that would stop rollout.
A strong answer may fund measurement before implementation. It will not fund ten ideas, treat the ranking formula as fact, or claim that an 82.375 ms production-window difference proves every mechanism in the decomposition.
Evidence and transfer limits
- Gene Amdahl’s original 1967 paper supplies the bounded-speedup argument. This chapter adapts it as an upper-bound habit; distributed tail latency and queues require richer models.
- NIST’s confidence-interval guidance explains repeated-sampling interpretation and the effect of estimated variance. It does not select Mercury’s experimental unit or practical threshold.
- PostgreSQL’s current
EXPLAINdocumentation defines plan nodes, estimated costs, actual execution, loops, and caveats. PostgreSQL behavior is an example, not a universal database model. - Google SRE’s canarying guidance supports partial, time-limited production evaluation and control comparison. Local systems still need assignment, interference, correctness, and rollback rules.
- All Mercury values are simulated teaching evidence reproduced by
examples/performance-engineering-system-design-handbook/part-07/optimization-workflow/. Passing checks validates arithmetic and declared packet structure, not a production optimization.
The decision rule is: implement an optimization only when its bounded end-to-end benefit, evidence quality, displaced cost, and durability justify complexity and opportunity cost. The next risk is change itself: even a verified gain can disappear—or cause an outage—when cold instances, mixed versions, duplicated traffic, and migrating state enter the workload.