Performance Engineering and System Design Handbook / Chapter 15
Virtualization, Containers, and Cloud Variability
Trace nominal infrastructure through guest scheduling, container controls, shared placement, and hidden service queues so variability becomes measurable capacity input.
Preparing audio…
Audio edition
Virtualization, Containers, and Cloud Variability
A utilization percentage is evidence only after its denominator names the capacity that can withhold progress. During one Mercury interval, 23.875%, 47.75%, and 95.5% CPU all described the same consumed work. Every ratio was arithmetically correct; only the last expressed the binding two-core quota.
At 09:42, Mercury API’s p99 latency rose from 39 ms to 92 ms. The application had no new release, dependency spans were flat, and neither the four-vCPU guest view nor the eight-CPU fleet denominator looked saturated.
The container’s accounting told a different story. It had a two-core CPU quota, consumed 95.5% of that allowance over the ten-second incident window, and was throttled in 37 of 100 enforcement periods for 1.42 seconds of aggregate throttled time. Its workload offered 480 successful reads per second at a modeled 4.1 core-ms of CPU service demand per success:
[ 480\ requests/s \times 0.0041\ core\text{-}s/request = 1.968\ cores ]
The workload was pressing directly against a two-core temporal budget. Guest steal time was present but small—0.12 seconds, or 1.2% of the wall interval. The misleading utilization was not a bad arithmetic result. It answered the wrong capacity question with the wrong denominator.
Three controls separated the competing explanations. At 360 requests/s on the same placement and quota, throttling fell to one period and p99 returned to 41 ms. A fresh dedicated placement with the same two-core quota still throttled in 35 periods at 480/s and produced an 88 ms p99. Raising the quota to four cores on the original workload removed throttling and returned p99 to 40 ms. That evidence makes quota throttling the leading cause. It does not prove that the host is interference-free, only that changing tenancy did not remove the incident while changing the binding control did.
Virtual infrastructure is a chain of schedulers, accounting boundaries, caches, queues, and policy. A nominal vCPU, container limit, storage class, or managed-service tier names a contract surface. It does not identify the physical resource delivered to one request at one moment. The engineering task is to trace the effective resource path and measure which boundary withheld progress.
One CPU chart can hide four schedulers
A process in a container inside a virtual machine can wait at several distinct layers:
- the application runtime decides which runnable task receives a language thread or worker;
- the guest kernel schedules that thread onto a virtual CPU;
- a cgroup controller may delay the group after it consumes a configured CPU budget;
- the hypervisor or host kernel schedules the virtual CPU onto a physical hardware thread.
The order is conceptual rather than universal implementation detail, but it exposes the diagnostic problem. An application queue can grow while the guest has idle vCPUs because the worker pool is capped. Guest run queues can grow while container CPU usage looks below a host-normalized percentage because the container quota is smaller than the host. A runnable vCPU can wait for physical execution because the host is overcommitted or doing other work. These waits have different controls and observable signatures.
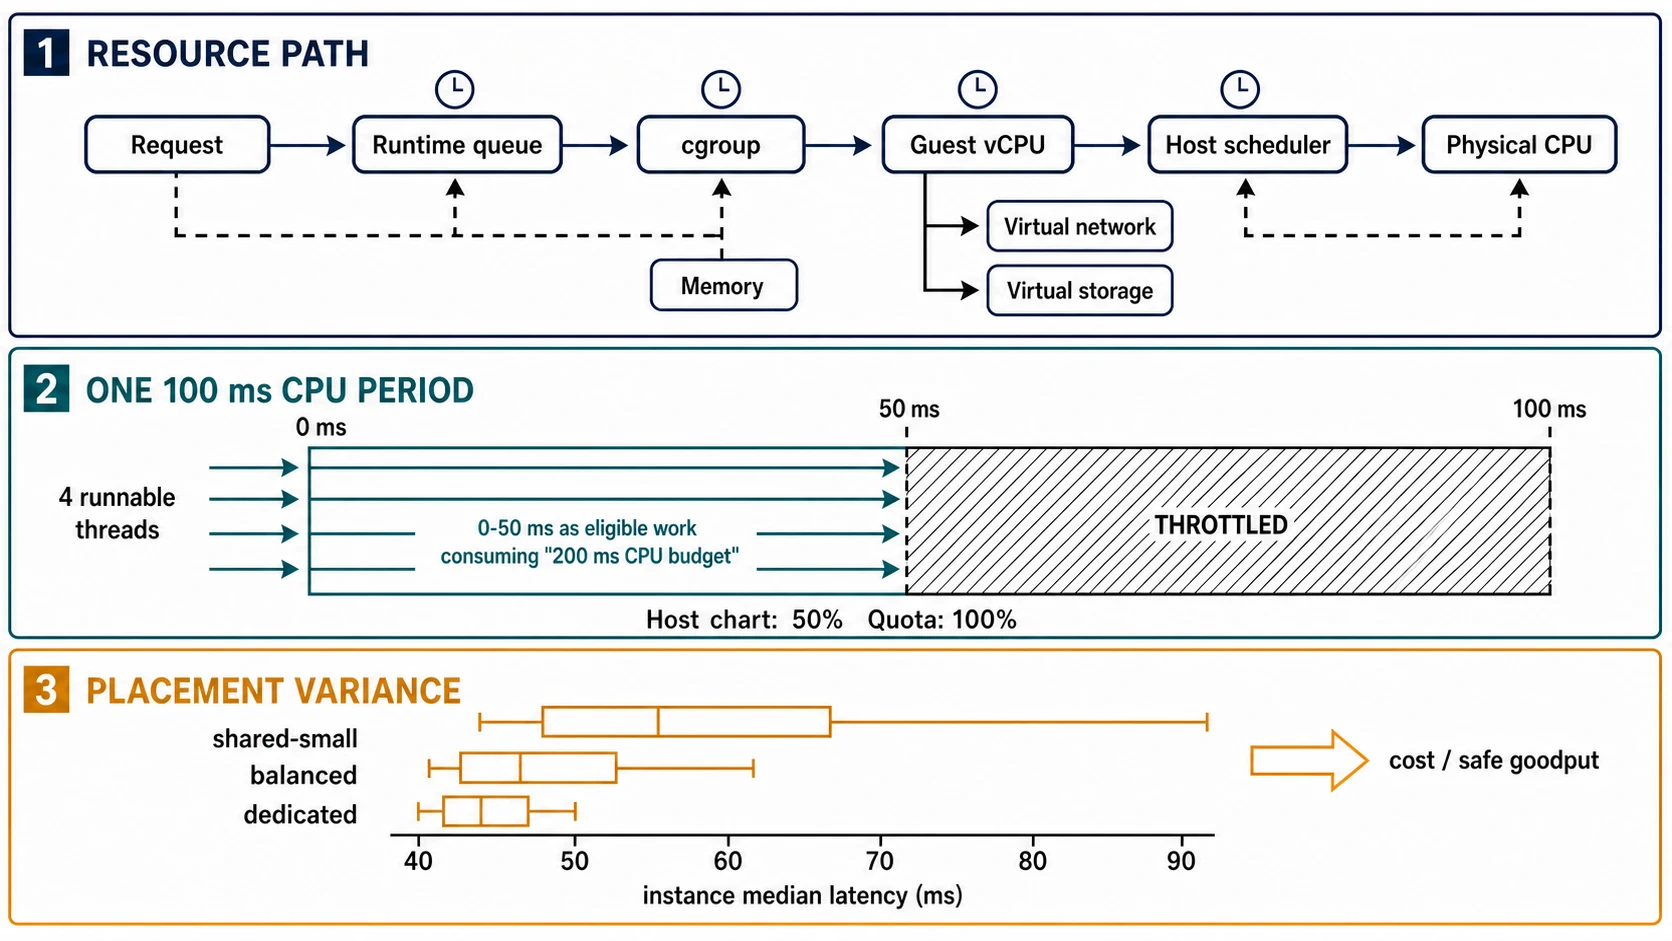
A virtual CPU is a schedulable guest execution context, not a promise of exclusive access to a particular physical core. Placement may share a physical core with another hardware thread, migrate across cores, cross NUMA boundaries, or wait while the host schedules other guests. Overcommit allocates more potential vCPU demand than the host can simultaneously execute. It can be economically sensible when workloads have uncorrelated idle periods; it becomes a latency risk when their peaks align.
In KVM’s documented x86 interface, steal time is time during which a vCPU did not run; idle vCPU time is not reported as steal. The update interval is implementation-dependent. That makes steal a useful clue when supported and correctly collected, not a complete measure of all host interference. Low steal does not rule out cache contention, memory-bandwidth saturation, device queues, interrupt work, frequency variation, or a container controller below the guest. High steal does not say which neighbor or host policy caused the delay.
Record CPU evidence with compatible denominators:
| Quantity | Mercury incident | Question answered |
|---|---|---|
| CPU service demand | 4.1 core-ms/success | how much CPU one correct completion consumes in this workload state |
| offered demand | 1.968 cores | how much CPU the offered successful workload would consume without waiting |
| consumed / two-core quota | 95.5% | how much of the configured container allowance was used |
| consumed / four guest vCPUs | 47.75% | how much guest-visible CPU capacity the process consumed |
| consumed / eight host logical CPUs | 23.875% | a host-normalized dashboard ratio, not the container’s capacity margin |
| throttled-period fraction | 37% | how often the group exhausted its temporal CPU budget |
| guest steal fraction | 1.2% | guest-visible time the vCPU was involuntarily not running, under this interface |
CPU demand, quota utilization, guest utilization, and steal are not interchangeable. The denominator belongs in the metric name or adjacent metadata.
Quotas are temporal budgets, not smaller processors
Linux cgroup v2 exposes cpu.max as a maximum bandwidth in a period. A value equivalent to two CPUs permits two CPU-seconds per wall second over its configured periods; it does not turn four vCPUs into two slower physical cores. A burst of parallel work can spend the period’s budget early and then wait even when the host has idle capacity.
Consider a simplified 100 ms enforcement period with four runnable guest threads and a 200 ms aggregate CPU allowance:
| Wall interval | Runnable work | Aggregate CPU consumed | Controller state | Request effect |
|---|---|---|---|---|
| 0–20 ms | 4 threads | 80 ms | eligible | four requests advance |
| 20–50 ms | 4 threads | 120 ms | allowance reaches 200 ms | burst consumes the period budget |
| 50–100 ms | 4 threads | 0 ms | throttled until replenishment | runnable requests wait about 50 ms |
| next period | 4 threads | budget replenished | eligible again | synchronized work resumes |
Over the whole guest, an observer may call the interval “50% utilized” because 200 ms was consumed across 400 ms of four-vCPU opportunity. For the cgroup, the allowance was fully consumed. The tail sees the 50 ms wall-clock gap, not the soothing host-average percentage.
cpu.weight answers a different question. It distributes CPU proportionally among contending sibling groups; it is not a hard reservation when the CPU is idle, nor a maximum when other groups are absent. cpu.max.burst, when available and deliberately configured, can allow saved runtime to absorb some bursts. It moves the burst contract; it does not create sustained capacity. Document controller version, hierarchy, period, quota, burst, weights, and whether siblings were actually runnable.
Distinguish four cases before changing limits:
| Signature | Leading mechanism | Discriminator |
|---|---|---|
| application queue age rises; quota has margin; no throttling; workers busy | application or runtime saturation | raise worker bound cautiously or profile service/wait demand at equal offered load |
| throttled periods and wall gaps align; demand approaches quota; steal low | cgroup CPU bandwidth | repeat below quota and with a higher quota while holding placement and workload constant |
| guest run queue and steal rise; cgroup has margin | host scheduling or overcommit | compare fresh placements and dedicated tenancy with the same guest/container controls |
| CPU pressure rises with little useful completion; service demand changes | contention, reclaim, spin, or wasted work | align profiles, pressure, cache/memory, retries, and correct goodput |
Changing several layers at once destroys the diagnosis. Moving to a larger instance, adding replicas, raising quota, and restarting the workload may fix the symptom while leaving the causal term unknown.
Containers isolate names and account work; they do not erase the host
Namespaces give processes scoped views of resources such as process IDs, mounts, network interfaces, users, and host names. Cgroups organize processes for accounting, protection, weighting, and limits. A container combines these and other kernel facilities with an image and runtime contract. It still uses the host kernel and competes for physical caches, memory channels, storage devices, network queues, and kernel work unless the platform provides and verifies stronger isolation.
This distinction prevents two common mistakes. First, namespace isolation is not a capacity reservation. A container may see only its own processes while sharing a memory controller or device path with other tenants. Second, a resource request used for placement is not necessarily the same as the runtime limit or guaranteed service. In current Kubernetes documentation, requests guide scheduling and CPU limits are normally enforced through cgroup throttling; memory enforcement has different, reactive failure behavior. Those semantics are version- and configuration-sensitive, so record the orchestrator version and the node’s actual cgroup files rather than reasoning from a manifest alone.
Accounting also has a hierarchy. Sidecars, init containers, nested groups, host agents, and kernel work may fall inside or outside the number a dashboard displays. A per-container CPU graph can omit a node-level packet-processing bottleneck. A pod total can hide which sidecar consumes the budget. A guest metric can include work from several containers. The boundary must match the decision.
Memory limits create a state machine before OOM
Memory does not behave like CPU bandwidth. CPU throttling delays work and later replenishes eligibility. Memory pages remain resident until freed or reclaimed, and reclaim itself consumes CPU and I/O while changing latency.
Useful cgroup v2 boundaries include:
memory.current: memory currently charged to the cgroup hierarchy;memory.low: best-effort protection against reclaim below a declared working set;memory.high: a throttle-like pressure boundary that forces reclaim and can slow allocating tasks;memory.max: the hard usage boundary after reclaim cannot satisfy demand;memory.events: counters that distinguish crossings, maximum pressure, and OOM outcomes;memory.pressure: time in which tasks are stalled by memory pressure, when PSI is available.
Mercury’s simulated snapshot is 2.4 GiB anonymous memory, 1.1 GiB file cache, and 0.2 GiB kernel memory, totaling 3.7 GiB. The group has memory.low = 2.8 GiB, memory.high = 3.5 GiB, and memory.max = 4.0 GiB. It has 218 high-boundary events, no max event, and no OOM kill. “No OOM” is therefore not “no memory problem.” The group is already crossing the reclaim boundary, and the file cache is part of the charged footprint.
The causal sequence can be:
- workload or cache state raises charged memory above
memory.high; - allocation paths perform or wait for reclaim;
- useful page-cache hit rate falls;
- storage reads and CPU service demand increase;
- request queues grow and deadlines expire;
- retries add work;
- only later, if reclaim cannot keep usage under
memory.max, an allocation fails or an OOM victim is selected.
Watch anonymous, file, slab/kernel, swap, faults, reclaim, PSI, storage reads, runtime heap/native memory, queue age, and useful completions together. Raising memory.max can postpone a kill while preserving destructive reclaim. Disabling cache can reduce charged bytes and increase device demand. A smaller heap can reduce resident pressure and increase collection frequency. The right design depends on the working set and failure contract.
OOM policy must say what is allowed to die, how the caller observes failure, whether partial work is durable, how retries are bounded, and how restart affects load. A container restart is not recovery if image pulls, cache refill, replay, and reconnection overload the survivors.
Virtual I/O adds mappings and queues
A network call described in Chapter 14 may pass through an application socket, guest kernel, virtual interface, host bridge or virtual switch, policy and encapsulation layers, host NIC queues, and a physical network. A storage operation may pass through a guest file system, guest page cache, virtual block device, host cache or device mapper, network storage client, provider control plane, and physical media. Some implementations bypass or combine layers; the diagnostic obligation remains to identify where bytes wait and where accounting occurs.
Virtual networking can add:
- packet classification, network-policy, address translation, tunneling, encryption, and virtual switching;
- guest and host queueing with different drop and backlog counters;
- CPU placement that separates application, virtual-device, and interrupt work across NUMA nodes;
- offloads that make packet counts and capture shapes depend on observation point;
- shared bandwidth or packet-rate limits that bind before nominal link bits/s.
Virtual storage can add:
- guest and host page caches whose hit/miss behavior differs;
- IOPS, byte-rate, queue-depth, burst-credit, or outstanding-request controls;
- copy-on-write image and snapshot paths;
- remote replication, checksumming, encryption, and background repair;
- control-plane operations such as volume attach, resize, or failover outside the data-path metric set.
Do not add every layer’s p99. Trace individual requests where possible, compare guest and host/device counters over aligned intervals, and use controlled changes to localize the delay. A guest device can appear idle because the host is throttling it upstream. A managed volume can show low queue depth at the guest while an external service queue grows beyond the exposed boundary.
Noisy neighbor is a hypothesis, not a diagnosis
“Noisy neighbor” compresses many mechanisms into one label: shared-core scheduling, last-level-cache eviction, memory-bandwidth contention, NUMA placement, storage interference, network queueing, power or thermal limits, host background work, and managed-service contention. Those mechanisms predict different evidence and different remedies.
Use a paired interference test:
- define the victim workload, success population, service demand, and objective;
- hold application build, guest image, limits, data, cache state, and offered schedule constant;
- repeat across fresh placements and time blocks;
- if possible, introduce one controlled aggressor class—CPU, cache/memory bandwidth, storage, or network—within an authorized test environment;
- align victim latency and goodput with the corresponding pressure and service-demand signature;
- remove the aggressor and require recovery, not merely an eventual restart;
- compare with a dedicated or differently isolated placement.
Correlation with a host move supports a placement effect but does not identify its mechanism. A dedicated host can still have NUMA mistakes, power limits, firmware activity, or a local storage bottleneck. Dedicated tenancy changes the prior probability and control surface; it does not abolish systems engineering.
Placement should include failure and locality constraints. Pinning tightly to one core or NUMA node can improve cache and memory locality while reducing failover flexibility and leaving capacity stranded. Spreading replicas across hosts or zones protects failure domains but may add cross-zone calls or heterogeneous paths. A placement decision needs normal, maintenance, failure, and recovery modes.
A nominal shape is a distribution
An instance shape usually bundles vCPU count, memory, network/storage eligibility, topology, and sometimes an expected processor class. Even when the label is stable, physical processor generation, frequency policy, NUMA layout, simultaneous multithreading, device path, host load, and placement can vary. Workload behavior determines whether those differences matter.
Mercury’s sampling plan treats a fresh placement—not a request and not a repeated loop—as the independent experimental unit. For each of three candidate profiles it allocates 12 independent placements across three zones and four time blocks, randomizes profile order within each block, and runs five repetitions after 180 seconds of warm-up with 480 seconds of declared steady state. Each run verifies response digests, successful count, workload mix, generator CPU, and scheduler lag.
The resulting instance-level median latencies are simulated:
| Profile | min | Q1 | median | Q3 | max | spread |
|---|---|---|---|---|---|---|
| shared-small | 42 ms | 46 ms | 52 ms | 63.5 ms | 88 ms | 46 ms |
| balanced | 41 ms | 43.5 ms | 46.5 ms | 51 ms | 58 ms | 17 ms |
| dedicated | 40 ms | 41.5 ms | 43 ms | 44.5 ms | 48 ms | 8 ms |
The five repetitions estimate within-placement noise; they do not turn one host into five independent hosts. Report the distribution across placement medians, plus within-placement variation, rather than pooling every request from every run into an enormous false sample size. Block by time and zone so a morning load change or one domain does not become a shape effect. Randomize order so warm caches, quotas, and background conditions do not always favor the same profile.
The benchmark manifest must preserve:
| Field | Required record |
|---|---|
| claim | the decision and metric population the comparison supports |
| workload | arrivals, operation mix, payloads, data/skew, cache state, duration, correctness |
| placement | shape, zone, topology when exposed, fresh/reused host evidence, tenancy |
| controls | guest image, kernel, runtime, cgroup hierarchy, quotas, memory, virtual devices |
| lifecycle | image presence, pull time, init, readiness, warm-up, steady state, drain |
| generator | achieved schedule/mix, client CPU, scheduler lag, connections, dropped samples |
| evidence | raw observations, run/placement IDs, counters, failures, missingness, timestamps |
| analysis | independent unit, blocking, randomization, exclusions, uncertainty, outlier policy |
| transfer | what provider, region, time, topology, workload, and failure states were not tested |
This checklist is a reproducibility artifact, not a promise that a short sample captures rare host events. Repeat long enough to include the operational state relevant to the decision, and re-sample after material platform, image, kernel, workload, or topology changes.
Hidden service limits still form queues
Managed databases, queues, object stores, and control planes expose an interface rather than their physical machines. They may enforce connection, request, byte, partition, metadata, concurrency, or background-work limits. Some limits reject immediately; others queue or slow work before an error appears. Client CPU and network can remain idle while a hidden admission boundary binds.
Model the service as a resource station even when its internals are opaque. Record attempted and correct goodput, client-side concurrency and queue age, response-time distribution, status/throttle signals, server-reported work when available, connection and stream residence, payload size, partition/key/tenant skew, and retry amplification. Sweep one demand dimension at a time under a bounded plan. A plateau in useful throughput with rising latency and stable client service demand supports an external capacity boundary; it does not reveal the implementation behind it.
Treat quotas and account-wide limits as deployable dependencies. A failover that doubles request rate into a surviving region can hit a control-plane or connection limit before compute saturates. Capacity exercises must validate both data-plane throughput and the operations needed to allocate, attach, scale, restore, or authorize resources.
Cold start is a resource path, not one duration
“Container start time” may include scheduling, capacity acquisition, sandbox or VM creation, image-manifest lookup, layer download, decompression, mount work, init containers, secret and configuration retrieval, process creation, runtime compilation, connection establishment, data or model loading, cache warming, registration, and readiness propagation. Some stages are cached; some serialize; some consume the same network or storage path needed by healthy replicas.
Separate at least these clocks:
- request for capacity to assigned placement;
- assigned placement to image available;
- image available to process started;
- process started to startup check passed;
- startup passed to ready for traffic;
- ready to representative latency and service demand;
- termination requested to traffic drained and resources released.
Readiness should represent ability to serve the declared traffic class, not merely that a process exists. Liveness should identify an unrecoverable condition; restarting a slow but progressing process under load can create a positive feedback loop. Current Kubernetes probe documentation explicitly separates startup, readiness, and liveness roles and warns that poorly designed liveness can cascade failures. Platform semantics evolve, so test the actual controller version and endpoint behavior.
Pre-pulling images reduces one term but consumes storage and does not warm application state. Smaller images can reduce distribution work while a large runtime initialization remains. Snapshots can accelerate restoration while preserving stale connections or increasing compatibility constraints. The test should reveal which term dominates before selecting a remedy.
Predictability has an economic denominator
The cheapest nominal instance can be the most expensive unit of safe service. Compare cost against safe goodput under the required variability and failure policy, not purchased vCPUs.
For the simulated profiles:
| Profile | modeled monthly cost | safe goodput | modeled cost per 100 safe requests/s | variability consequence |
|---|---|---|---|---|
| shared-small | 630 units | 390/s | 161.54 units | broad placement spread requires more headroom or rejection |
| balanced | 820 units | 510/s | 160.78 units | lowest modeled cost per safe unit and moderate spread |
| dedicated | 1,120 units | 560/s | 200.00 units | narrowest spread, highest modeled unit cost |
These are fixture values, not provider prices. They show why price per vCPU is insufficient. The balanced profile is slightly cheaper per 100 safe requests/s than shared-small because its lower variance allows more of nominal capacity to be assigned safely. Dedicated capacity buys further predictability but does not pay back under this workload’s modeled objective. A stricter jitter contract, license-per-instance cost, security boundary, or failure-recovery requirement could reverse the decision.
Include engineering and operational costs: extra replicas, warm pools, longer experiments, placement controls, topology constraints, migration, fragmentation, capacity reservation, and incident risk. Shared capacity is attractive when the workload tolerates variance, admission absorbs it, and diversity reduces correlated risk. Dedicated capacity is attractive when jitter materially violates the objective, interference is evidenced, reservations improve failure capacity, or variance headroom costs more than isolation.
Applied diagnosis: name the withholding boundary
For each packet below, choose the leading mechanism and one controlled discriminator. Do not prescribe a larger shape until the evidence identifies a boundary.
- Container CPU is 62% of quota, throttling is zero, guest steal is 14%, guest run queues rise, and a fresh dedicated placement recovers at equal workload.
- Container CPU is 96% of quota, throttled-period fraction is 41%, steal is 1%, and both shared and dedicated placements fail until quota rises.
- CPU and steal are low,
memory.highevents and memory PSI rise, file-cache hit rate falls, storage reads double, and no OOM occurs. - Guest metrics are flat, client concurrency and queue age rise, useful throughput plateaus, and a managed service emits a throttle signal after a delay.
Plausible answers are host scheduling for (1), CPU bandwidth for (2), reclaim and cache displacement for (3), and an external service boundary for (4). The answer is incomplete without the held-constant workload, metric boundaries, and a reversible test.
Principal drill: design a stable profile
Mercury expects a 2.4× launch burst and must survive one unavailable zone. A new image is 1.8 GiB, uncached pulls share the node’s storage/network path, the application needs 75 seconds after process start to warm indexes, and a managed dependency permits 900 concurrent operations per zone. Shared placements are 22% cheaper per nominal vCPU but have the spread shown above. Design:
- the fresh-placement benchmark and independent sampling unit;
- CPU, memory, virtual network/storage, and external-service measurements;
- quota, request, memory-high/max, queue, admission, and readiness policies;
- pre-scale and image-distribution timing;
- zone-loss concurrency and dependency-limit arithmetic;
- abort, correctness, recovery, and drain criteria;
- shared, balanced, or dedicated selection using cost per safe goodput;
- the evidence that would trigger a different profile later.
A credible answer may choose balanced steady capacity plus pre-scaled warm replicas, bounded admission below the surviving dependency limit, and a smaller emergency dedicated pool. Another may choose dedicated placement because the launch contract prices jitter more heavily. The rubric rewards explicit boundaries and recoverable evidence, not one topology.
Evidence and transfer limits
- Linux cgroup v2 documentation defines the current kernel interfaces used here, including CPU bandwidth, weights, memory boundaries, events, and cgroup pressure files. Controller availability and behavior remain kernel- and configuration-specific.
- Linux pressure stall information documentation explains CPU, memory, and I/O stall accounting. PSI reports lost progress time; it does not identify root cause by itself.
- Linux KVM x86 MSR documentation defines KVM steal-time accounting and its implementation-dependent update interval. Other hypervisors and architectures require their own evidence.
- Kubernetes resource-management documentation describes current request, limit, cgroup, throttling, and memory behavior. The chapter does not generalize those semantics to every orchestrator or version.
- Kubernetes probe documentation distinguishes startup, readiness, and liveness behavior and its failure implications.
- All Mercury numbers, distributions, costs, and controls are simulated teaching evidence reproduced by
examples/performance-engineering-system-design-handbook/part-02/cloud-variability/. The fixture verifies arithmetic and experiment structure, not production transfer.
The durable rule is: treat infrastructure shape, policy, and variance as workload inputs. Normalize evidence to the boundary that can withhold progress, sample independent placements and lifecycle states, and buy predictability only against safe goodput and failure economics.
The remaining machine decision is whether a general-purpose CPU path should remain general purpose at all. Accelerators can move the dominant term, but they add their own scheduling, memory, transfer, sharing, and variability boundaries; nominal device count is no more sufficient than nominal vCPU count was here.