Performance Engineering and System Design Handbook / Chapter 12
Allocation, Garbage Collection, and Managed Runtimes
Diagnose runtime latency and footprint from allocation velocity, object lifetime, collection work, safepoints, native memory, and warm-up evidence.
Preparing audio…
Audio edition
Allocation, Garbage Collection, and Managed Runtimes
Every allocated byte starts a lifetime clock. Some bytes become unreachable before the next collection. Some survive several cycles and are copied, promoted, counted, or traced repeatedly. A small fraction remains reachable for the life of the process. The runtime must eventually discover which is which, recover space, and coordinate that work with application threads.
That is the useful model: heap occupancy is a snapshot of state, while allocation velocity and survival create work. A 4 GiB heap that changes slowly can be cheap to maintain. A 2 GiB heap turning over at 1 GiB/s can consume cores, memory bandwidth, and pause budget even though its size looks stable. Making the heap larger may delay a collection without removing one byte of allocation demand.
The model becomes decisive when request latency forms a sawtooth, process memory exceeds the reported heap, a deployment is slow only while warming, or a collector flag is proposed before anyone has measured object lifetimes. Read the allocation profile, relate lifetime to collector behavior, separate pause from concurrent cost, and locate retention before deciding whether policy tuning or an object-graph change attacks the causal term.
Every byte creates an allocation and reclamation obligation
Use one managed-runtime process as the accounting boundary and one correct Mercury API recommendation response as the unit of useful work. Within that boundary, the application allocates request objects, decoded fields, intermediate ranking records, response buffers, cache entries, runtime metadata, and compiled code. Outside it sit kernel page management, remote services, and durable storage. They still interact with the process, but “the GC did it” is not an explanation for every memory or latency event.
An allocation profile should connect four quantities:
- Allocated bytes per correct completion, segmented by operation and call site.
- Allocation rate, in bytes/s, for a declared workload interval.
- Survival or lifetime distribution, not merely object count.
- Post-reclamation live set, including the paths retaining it.
The fictional Mercury fixture models this lifetime population by allocated bytes:
| Lifetime after allocation | Share of allocated bytes | Likely consequence |
|---|---|---|
| 0–10 ms | 72% | usually dead before or at the next young collection |
| 10–100 ms | 15% | short-lived, but exposed to collection cadence |
| 100 ms–1 s | 7% | survives some young cycles and may be copied |
| 1–60 s | 4% | creates promotion and repeated-tracing pressure |
| over 60 s | 2% | contributes to the long-lived live set |
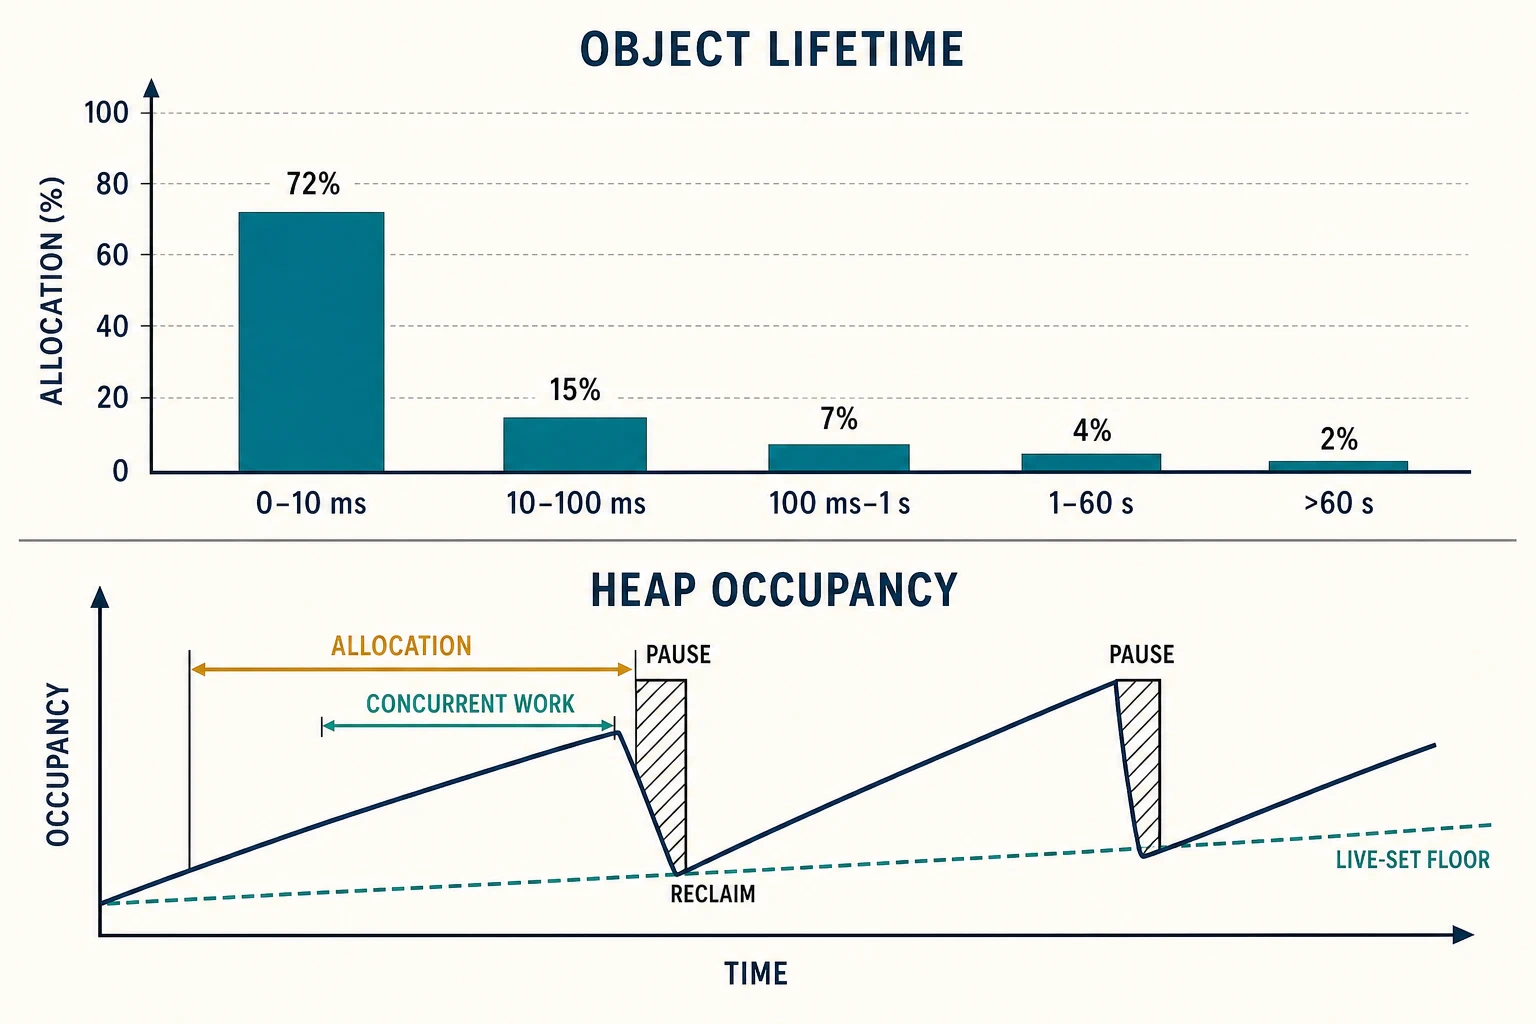
The histogram supports a generational hypothesis: recently allocated objects in this workload are more likely to die soon than objects that have already survived. It does not prove that every workload has that shape. An in-memory graph engine, a cache warmer, or a batch that builds a complete model may allocate mostly long-lived state. Measure the distribution at representative phases before selecting a policy around it.
Object count alone can also mislead. One million 32-byte records and one thousand 4 MiB buffers create very different copying, clearing, fragmentation, and cache costs. Keep both bytes and counts, and segment exceptional large allocations rather than hiding them in an average.
Allocation has fast paths, slow paths, and shape costs
Managed allocation is often cheap on its fast path. A thread or worker may own a bump-pointer region: reserve the next aligned span, advance a pointer, initialize required memory, and continue without contending on a global allocator. Thread-local allocation buffers and per-arena free lists are examples of a broader design: make common small allocations local and defer coordination.
The slow path appears when the local region cannot satisfy a request. The runtime may refill from a shared region, search a size-class free list, obtain or commit more pages, request a collection, or allocate a large object through a separate path. A benchmark that repeatedly allocates one tiny object inside a warm local buffer measures only the first path.
Size classes trade internal waste for fast reuse. A 33-byte request placed in a 48-byte slot consumes 15 bytes the application cannot use. That is internal fragmentation. External fragmentation means total free space exists but is divided into spans that cannot satisfy the requested shape. A process can therefore fail a large allocation or grow its address space even when aggregate free bytes appear sufficient.
Arenas reduce contention and can improve locality, but multiple arenas may retain partially used pages. A thread churn can strand cached spans after the workload moves elsewhere. Compaction can restore contiguous space by moving live objects, at the cost of tracing, copying, reference updating, barriers, and coordination. Pinning makes some objects immovable and can turn an otherwise compacting design into fragmented islands.
The allocation path also interacts with Chapter 10’s locality model. Object placement determines which cache lines and NUMA nodes later serve accesses. A “zero-copy” interop buffer may avoid one application copy while adding pinning, native lifetime, and remote-memory costs. Count the copies actually removed and the ownership obligations added.
Collector families move work to different moments
Collector labels combine several mostly independent choices: how liveness is established, which region is collected, whether live objects move, when work runs, and which threads pay. Compare mechanisms rather than treating names as a single ladder from old to modern.
| Mechanism | Reclamation basis | Cost placement | Characteristic risk | Favor when |
|---|---|---|---|---|
| tracing | traverse reachable objects from roots; reclaim the rest | periodic graph work, sometimes concurrent | live-set scan and coordination cost | cyclic graphs and batched reclamation fit the workload |
| reference counting | update ownership counts as references change | incremental write/update cost | cycles, decrement cascades, synchronization overhead | prompt reclamation or ownership structure is valuable |
| region/arena ownership | reclaim a whole region when its owner or phase ends | allocation and lifetime discipline | one escaping reference extends a region or requires copying | lifetimes align with request, query, frame, or batch phases |
| copying/compacting | move survivors and reclaim contiguous space | bandwidth, reference updates, barriers | pause or concurrent relocation overhead; pinning friction | locality and fragmentation reduction justify movement |
| nonmoving sweep/free lists | retain addresses and reuse discovered holes | free-list search and fragmentation | large or irregular allocation failure | address stability matters and fragmentation is controlled |
Tracing and reference counting are not pure opposites in production implementations. Deferred counts, cycle detection, remembered sets, write barriers, and generational tracing create hybrids. Likewise, “concurrent collector” does not mean “no pauses,” and “generational” does not imply one particular compaction or scheduling policy.
The decision variables are concrete: mutation rate, allocation velocity, lifetime distribution, live-set size, pointer density, large-object mix, pinning, required headroom, available CPU, memory bandwidth, and latency objective. A throughput-oriented batch can accept longer pauses to minimize barriers or concurrent CPU. A latency-sensitive service may spend more CPU and memory headroom to shorten coordination windows. Neither policy wins without the objective and workload.
A pause is only the visible slice of a collection cycle
Application threads are often called mutators because they mutate the object graph while allocating and changing references. A collector may perform root processing, marking, remembered-set work, reference processing, evacuation, sweeping, compaction, and cleanup. Some phases can overlap mutator execution; other phases require a consistent view or coordinated transition.
Three costs must remain separate:
- Pause cost: application progress stops or is constrained for a coordination phase.
- Concurrent cost: collector threads compete with application work for CPU, bandwidth, and cache capacity.
- Barrier cost: reads, writes, or allocations execute additional bookkeeping on the mutator path.
A short pause goal can increase collection frequency, concurrent work, barriers, or memory headroom. A large heap can reduce cycle frequency while increasing the amount of live state to inspect or the recovery time after failure. A concurrent collector can miss its required headroom when allocation outruns reclamation, forcing a more disruptive fallback. The operational question is not “How long was GC?” but “Which collector and mutator work consumed which resource, in which phase, and what useful completions were displaced?”
Mercury’s simulated process has an 8-core quota. Application work consumes an estimated 5.1 cores at the target workload while concurrent collection consumes another 1.2. Host CPU may look below 100%, yet the remaining 1.7-core margin must absorb bursts, compilation, telemetry, kernel work, and failure. Tightening a pause goal without checking collector CPU can move latency from a stop-the-world event into runnable delay—the scheduling mechanism Chapter 11 exposed.
Allocation velocity predicts collection cadence
At 1,500 correct completions/s, Mercury allocates 614.4 KiB per completion. The modeled rate is:
[ A = \lambda b = 1{,}500\ \text{completions/s} \times 614.4\ \text{KiB/completion} \div 1{,}024 = 900\ \text{MiB/s} ]
where (A) is allocation rate, (\lambda) is correct completion rate, and (b) is allocated bytes per correct completion. This calculation assumes the operation mix is stable; retries and failed attempts need their own allocation populations.
If the effective young-allocation budget is 1,843.2 MiB, a first-order cycle interval is:
[ T_{cycle} \approx \frac{B_{young}}{A} = \frac{1{,}843.2\ \text{MiB}}{900\ \text{MiB/s}} = 2.048\ \text{s} ]
This is a teaching estimate, not a runtime scheduling formula. Survivor occupancy, adaptive sizing, large-object paths, concurrent-start policy, fragmentation, and allocation bursts can trigger different behavior. Its value is diagnostic: if p99 rises about every two seconds and the allocation budget fills on the same cadence, the model predicts where to look.
The heap timeline shows collections at roughly two-second intervals. Used memory falls after each cycle, but the post-collection floor rises from 3,690 MiB to 3,825 MiB while request p99 peaks climb from 137 ms to 164 ms. Three hypotheses remain plausible:
- More request data survives and increases copy/trace work.
- A cache or queue retains objects intentionally but without a bound.
- Allocation rises, shortening the interval until background work overlaps the next cycle.
Heap occupancy alone cannot choose among them. The discriminating packet needs allocation rate by call site, age/survival, post-collection live-set trend, retaining paths, collector phase time, pause causes, collector CPU, and request outcomes aligned on one timeline.
Diagnose the sawtooth before touching a flag
Suppose Mercury’s latency dashboard shows a repeating tooth. Start with conservation rather than configuration:
allocated bytes
  = bytes reclaimed young
  + bytes surviving/promoted
  + live-set growth
  + measurement/accounting difference
Then align five views. Mercury allocates 900 MiB/s, concentrated in decoded field maps and ranking candidates, so the turnover belongs to the operation rather than to heap size alone. Of those bytes, 87% die within 100 ms. Young reclamation should therefore recover plenty of space, but it must run often: about 1.8 GiB arrives between young cycles, matching the 2.048 s first-order estimate.
That explains the teeth, but not the rising floor beneath them. The post-collection live set grows by 6 MiB/min over the two-hour sample, evidence of retention beyond the ordinary sawtooth. Finally, the request timeline makes the cost visible: latency peaks coincide with coordination and collector CPU, and deadline failures rise. The packet now supports two claims rather than one vague diagnosis. High transient allocation is driving reclamation cadence, while a separate retaining path is enlarging the work each cycle must preserve.
The sawtooth diagnosis is inferred until a controlled change discriminates it from other periodic work. Offset a checkpoint or metrics flush; capture allocation and heap profiles; reduce one allocation source; compare equal workload windows. Correlation at a cycle boundary is stronger than a dashboard coincidence, but causality still requires the change.
Heap size alone is a weak diagnostic because it mixes capacity and contents. Allocation rate says how quickly reclamation demand arrives. Live-set size says how much reachable graph remains to scan or preserve. Survival says which regions and generations carry that graph. Pause and concurrent phase records say where work was scheduled. Use all four.
Compilation changes the program while it runs
A managed runtime may begin by interpreting code or compiling quickly with limited optimization, collect execution profiles, then compile hot paths more aggressively. The executing program therefore changes during warm-up. Method popularity, branch types, call targets, code cache state, class loading, and runtime feedback can alter throughput and latency even when inputs are constant.
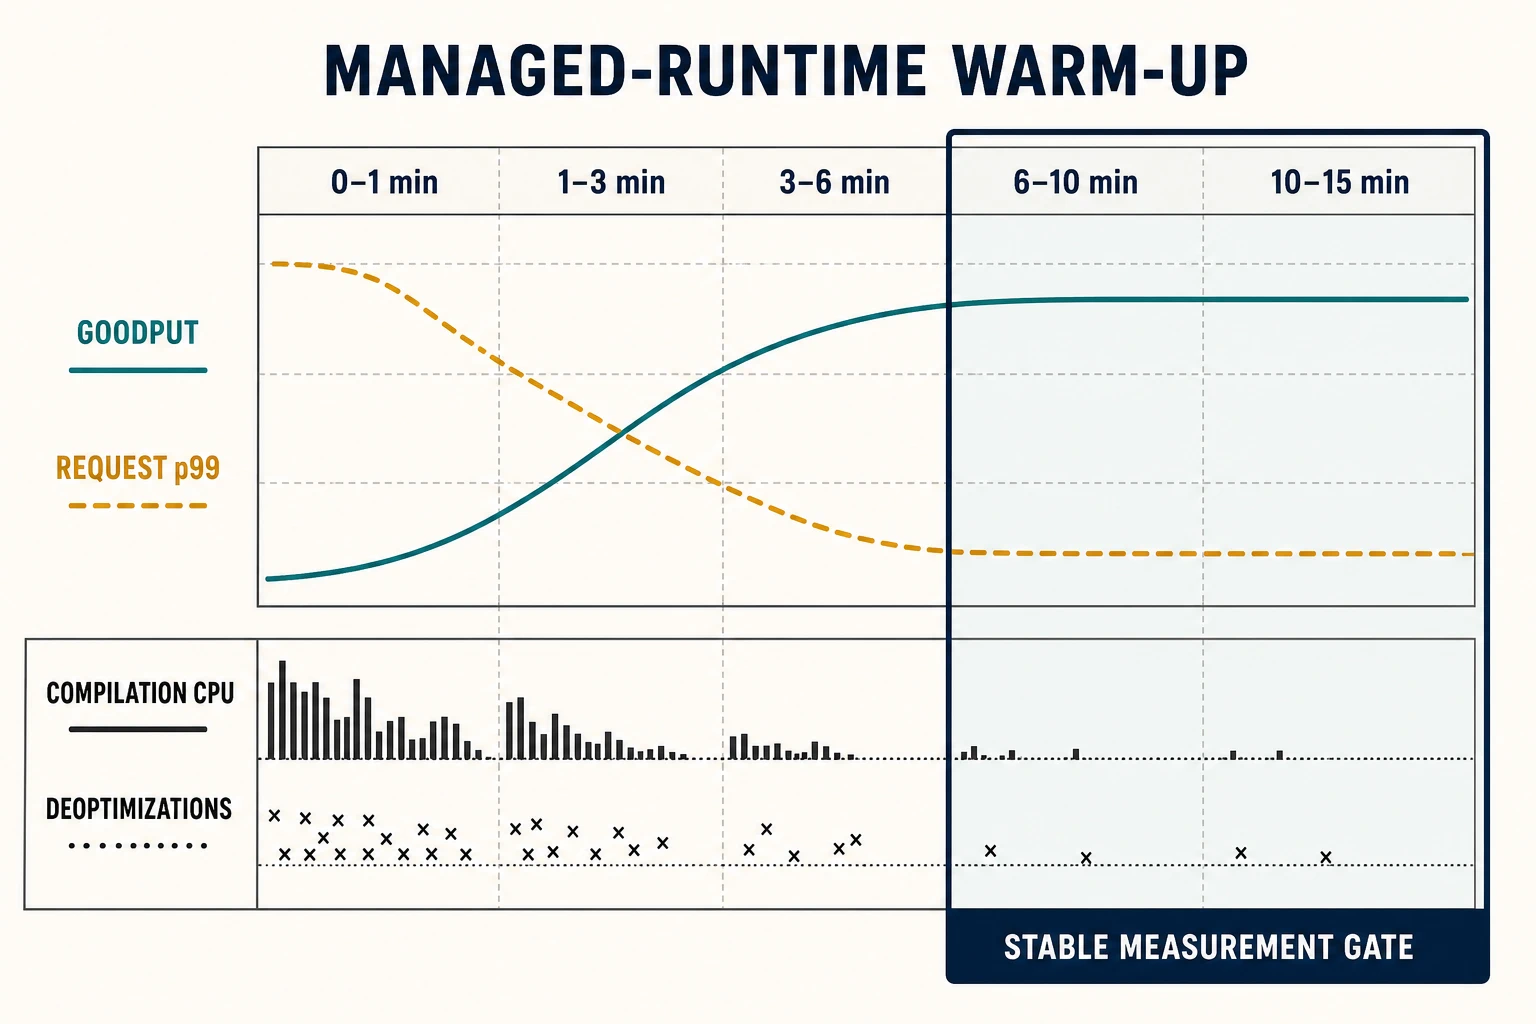
In the fixture, goodput rises from 780/s in minute 0–1 to about 1,512/s in minutes 10–15. Request p99 falls from 310 ms to 141 ms, compilation CPU from 24% to 2%, and deoptimizations from 19 to 1 per window. “Discard the first five minutes” would still include a changing program.
Deoptimization occurs when optimized code’s assumptions no longer hold or runtime policy invalidates that code. Execution may transfer to less optimized code, gather new profiles, and compile again. A new request type, class-loading event, feature flag, or traffic mix can therefore produce a second warm-up after the process appeared steady.
Profile-guided behavior creates two benchmark traps. First, warming only the candidate gives it a state advantage. Second, a synthetic monomorphic workload can teach the compiler assumptions that production’s diverse call paths violate. Record warm-up criteria, compilation/deoptimization activity, code and data state, request mix, and run order. Chapter 51’s five-field benchmark contract applies to runtime state as strictly as to cache state.
Safepoints coordinate more than reclamation
A safepoint is a runtime coordination point at which thread state is inspectable enough for a global or scoped operation. Exact mechanisms vary. Garbage-collection root work may use safepoints, but class redefinition, deoptimization, stack inspection, biased-lock or runtime maintenance in particular implementations can also require coordination. “Safepoint pause” and “garbage-collection pause” are not interchangeable populations.
Total coordination delay can include time to request the operation, time for threads to reach a safe state, and time spent performing the operation. A thread in a long native call or a loop with sparse polling may delay arrival in some runtimes. When one reported pause exceeds the collector’s own phase sum, inspect time-to-safepoint and non-GC operations before blaming object traversal.
Stop-the-world is also not a collector identity. A mostly concurrent collector can retain short global coordination phases. A throughput collector can parallelize a longer pause across many cores. Measure duration, frequency, cause, affected thread population, and resulting deadline success. A 2 ms pause at 200 Hz and a 100 ms pause once per hour pose different capacity and tail questions.
The managed heap is not process memory
Resident set size can grow while the managed live heap remains flat. The process also owns thread stacks, JIT code, runtime metadata, native libraries, direct buffers, memory maps, allocator arenas, telemetry queues, and kernel-accounted pages. Native components may have their own caches and fragmentation behavior.
Pinning prevents relocation for a period so native code or an external device can rely on an address. It can be necessary at an interop boundary, but long-lived or widespread pinning reduces compaction freedom and can increase fragmentation. Copying into a bounded native buffer may outperform pinning a large, irregular managed graph; the reverse may hold for a short transfer. The decision needs buffer size, pin duration, transfer frequency, copy bandwidth, collector behavior, and failure cleanup.
Off-heap does not mean free. It moves allocation, reclamation, limits, telemetry, and often correctness outside the managed heap. A direct buffer whose wrapper is reclaimed later than the native memory pressure arrives can exhaust process or container memory before heap occupancy looks alarming. Give native memory an owner, bound, release path, and metric.
Mercury’s two-hour retention packet shows post-collection live heap rising by 720 MiB while native memory rises only 26 MiB. Cache entries triple from 420,000 to 1,260,000. That evidence ranks a managed retaining path above a native leak, though it does not prove intent. A heap dominator or retaining-path profile must identify why entries remain reachable.
Reachability can outlive usefulness
A memory leak in a managed system usually means memory remains reachable after its useful lifetime. Common roots include unbounded caches, listeners never removed, maps keyed by tenant or request identity, completed futures retained by registries, queues whose consumers fell behind, thread-local state tied to long-lived workers, and native handles held by reachable wrappers.
Separate three growth shapes:
- Bounded cache warm-up: the live set rises toward an intentional capacity, hit rate improves, and eviction stabilizes occupancy.
- Workload-proportional state: growth follows tenants, sessions, or retained history and matches a declared capacity model.
- Unbounded retention: post-collection live state grows with elapsed work after the useful population should have expired.
A flat heap ceiling does not absolve retention. A collector may work harder and evict useful caches to stay within the ceiling. Watch post-collection live set, allocation rate, promotion/survival, collection frequency, cache population, queue age, and useful hit or completion outcomes together. Time is often the missing dimension; a six-minute test cannot expose a 6 MiB/min leak that becomes operationally significant after a day.
Change policy only after locating the causal term
Mercury has two proposed changes. Option A raises the heap and relaxes the pause target. Option B replaces per-request decoded maps with a reusable typed representation, bounds a candidate cache, and releases one native buffer at request completion.
The fixture models Option B reducing allocated bytes per completion from 614.4 KiB to 368.64 KiB. At the same 1,500 correct completions/s, allocation falls from 900 MiB/s to 540 MiB/s—a 40% reduction. With the same 1,843.2 MiB teaching budget, the first-order cycle interval increases from 2.048 s to about 3.41 s. Concurrent collector demand falls from 1.2 to 0.72 cores, live set from 3,584 to 3,379.2 MiB, and request p99 from 142 to 103 ms in the simulation.
Those values do not promise the same effect in a real runtime. They demonstrate why demand reduction has a different causal reach: it removes allocation, initialization, barrier, tracing, copying, and cache pressure. Heap tuning can still be right when the live set legitimately needs space or the collector starts too late. Collector selection can be right when relocation or pause policy conflicts with the objective. But a policy knob that merely postpones unavoidable work needs headroom and recovery analysis.
| Choice | Favor when | Main cost moved | Failure mode | Decisive evidence |
|---|---|---|---|---|
| adjust heap/region sizing | live set is legitimate and headroom is demonstrably insufficient | footprint and cycle timing | swap/container pressure or longer recovery | live set, cycle start, process memory, failure headroom |
| adjust pause/concurrency policy | collector scheduling conflicts with the latency/throughput objective | CPU, barriers, frequency, headroom | concurrent work steals useful capacity | phase CPU, pauses, runnable delay, goodput |
| select a different collector strategy | lifetime, relocation, or pause requirements mismatch current mechanism | implementation and operational complexity | new barrier, footprint, or fallback behavior | representative controlled comparison |
| remove transient allocation | profiles identify unnecessary object creation | engineering/change risk | complexity without end-to-end materiality | bytes/completion, profile, CPU and goodput change |
| reduce retention/change ownership | reachable graph outlives useful state | cache hit rate or recomputation | correctness loss from premature release | retaining paths, useful population, eviction/rebuild behavior |
Run an allocation-profile review
Use the retained packet:
node examples/performance-engineering-system-design-handbook/part-02/managed-runtime/run.mjs
node examples/performance-engineering-system-design-handbook/part-02/managed-runtime/verify.mjs
Then ask these questions of a real capture:
- What is the unit of correct useful work, and which attempts or retries allocate outside it?
- Which call sites dominate allocated bytes and object counts?
- What are allocation rate, live set, survival, and large-object rate by operating phase?
- Which roots and retaining paths explain post-collection growth?
- How much CPU, bandwidth, and wall time belong to mutators, barriers, concurrent collection, pauses, and compilation?
- Are pause cause, time-to-safepoint, and runtime maintenance distinguished?
- Which memory is managed heap, native allocation, stack, code, mapped file, or allocator slack?
- What pins or crosses the native boundary, for how long, and who releases it?
- Has warm-up reached declared stability for workload, compilation, cache, heap, and background work?
- Would the proposed change remove demand, reschedule it, or move it beyond the observed boundary?
Diagnostic drill: rank the sawtooth hypotheses
Given Mercury’s heap cycles, 900 MiB/s allocation, 87% sub-100 ms lifetime, 6 MiB/min live-set drift, and aligned request p99, rank three hypotheses and name one discriminating test for each. A strong answer ranks high transient allocation plus a separate cache-retention path above a purely native leak; it reduces one dominant allocation call site under equal offered load, captures retaining paths for the cache, and keeps native-memory telemetry as a falsification check. It does not change three collector flags at once.
Design drill: protect a 120 ms p99 objective
Choose between a larger heap, a low-pause collector mode, and the 40% allocation-demand reduction. State CPU quota, process-memory limit, cold/warm state, failure headroom, and correctness constraints. Estimate cycle cadence, identify which cost each option moves, and design a paired workload test with raw allocation and request populations. More than one option may be valid; the answer fails if it reports only pause duration or ignores process memory and recovery.
The durable rule is simple: tune runtime policy after measuring allocation, lifetime, pause, and concurrent-work behavior. Prefer reducing unnecessary allocation and retention when those are the causal terms. Once volatile process memory is accounted for, the unresolved boundary is durable bytes: logical operations must still cross file systems, device queues, media, and an explicit acknowledgment point.
Sources and evidence scope
- Paul R. Wilson, “Uniprocessor Garbage Collection Techniques” surveys reference counting, tracing, copying, compaction, incremental, and generational mechanisms; it supports the mechanism taxonomy, not performance claims for modern runtimes.
- Oracle’s Java 26 HotSpot Garbage Collection Tuning Guide documents current HotSpot collector goals, phases, headroom, and implementation-specific tuning behavior. Its defaults do not transfer to other runtimes or versions.
- Oracle’s Java 26 Virtual Machine Guide describes HotSpot tiered compilation and code-cache behavior; it supports the warm-up discussion for that dated implementation.
- OpenJDK’s HotSpot glossary defines HotSpot roots, GC maps, generations, and safepoint-related terms. Other runtimes coordinate threads differently.
- Microsoft’s .NET garbage-collection performance guide documents managed-heap diagnosis, fragmentation, pinning, finalization, and retaining-reference checks for .NET.
- OpenJDK JEP 439, Generational ZGC is a concrete modern design record for concurrent generational collection and relocation. It is an implementation source, not a universal latency guarantee.
- All Mercury lifetime, heap, allocation, warm-up, CPU, retention, and latency values are simulated teaching evidence in
examples/performance-engineering-system-design-handbook/part-02/managed-runtime/.